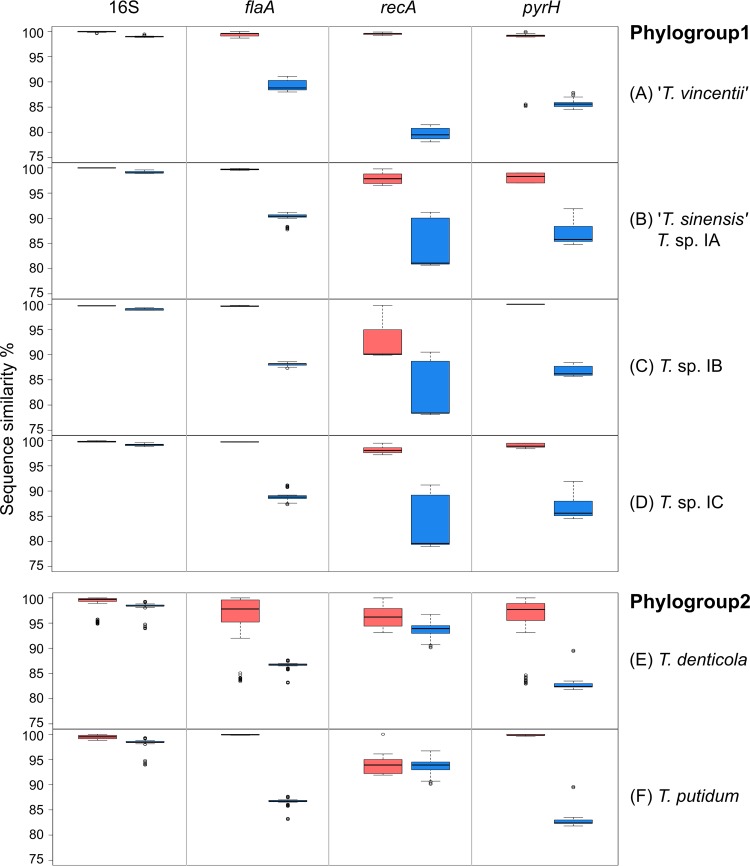
FIG 5.
Intra- and interspecific sequence similarity (%) for individual treponeme phylogroups. The respective levels of intra- and interspecific sequence similarity (in %) for the 16S rRNA, flaA, recA, and pyrH genes are shown for T. vincentii (A), T. sinensis (Treponema sp. IA; panel B), Treponema sp. IB (C), Treponema sp. IC (D), T. denticola (E), and T. putidum (F). Interspecific gene sequence similarity is indicated by blue shading, and intraspecific gene sequence is indicated by pink shading. The boxes indicates the lower/upper quartiles and the median, and the whiskers indicate the maximum and minimum values (Q3 + 1.5 IQR and Q1 − 1.5 IQR), excluding the outliers, which are indicated as open circles.

