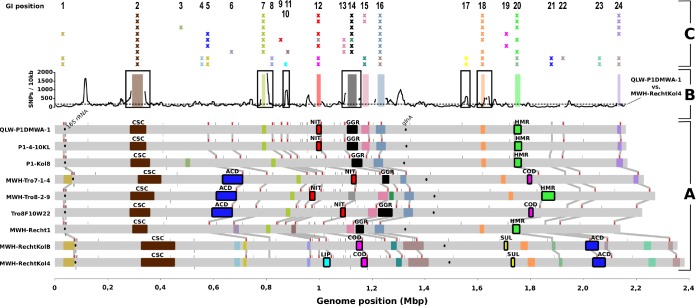
FIG 3.
Genomic islands in P. asymbioticus. (A) The nine P. asymbioticus genomes are shown in a linear representation. The genome position with respect to the origin of replication is shown on the horizontal axis at the bottom. GIs are depicted as colored boxes. The 28 GI variants are represented by different colors. The six variants for which a putative metabolic function was inferred from gene annotation are framed in black and named (ACD, aromatic compound degradation; NIT, assimilatory nitrate reduction; LIP, lipid metabolism; COD, carbon monoxide dehydrogenation; SUL, sulfate transport; HMR, heavy metal resistance). Two further variants which are discussed in the text are named as well (CSC, cell surface composition; GGR, giant gene region). The small bars above and below the genomes depict tRNAs. Those tRNAs which are supposed to be potential target sites for integrases, as inferred from the localizations of GIs, are highlighted in red, and the respective genome positions in the nine genomes are connected. The positions of the 16S rRNA and glutamine synthetase (glnA) genes, of which sequences are publicly available from various Polynucleobacter strains, are indicated by black ovals. (B) The number of SNPs from a pairwise comparison of the QLW-P1DMWA-1 and the MWH-RechtKol4 genomes is shown in a sliding window (window size, 10 kbp; step size, 1 kbp) along the genome of QLW-P1DMWA-1. The dashed line indicates the average number of SNPs in the aligned sequences. Gaps in the graph result from alignment gaps larger than 5 kbp. GIs of QLW-P1DMWA-1 are depicted by colored bars. GIs which are suspected to stem from homologous recombination events, suggested by a SNP peak in flanking regions, are framed in black. (C) The 24 genome positions where GIs can be found among the nine genomes are numbered and displayed at the respective QLW-P1DMWA-1 genome positions. The presence of GIs at these positions is indicated by crosses, colored as in panel A. The nine genomes are arranged one below the other in the same order as in panel A.

