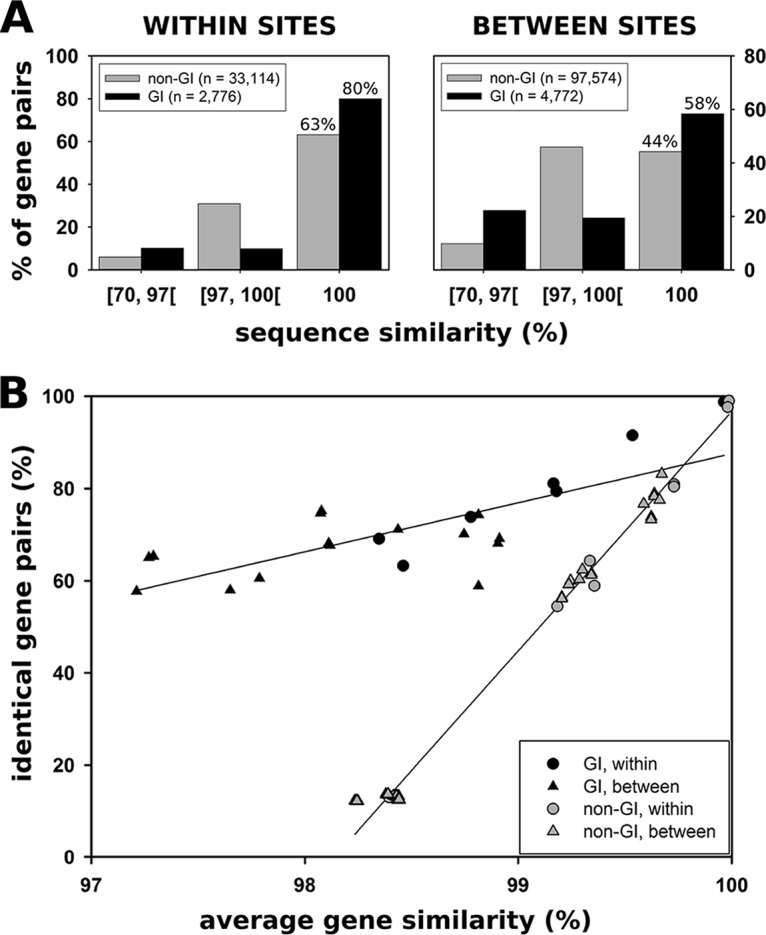
FIG 6.

Sequence similarities of GI and non-GI genes. (A) Proportion of gene pairs exhibiting similarities in the range of ≥70% to <97%, in the range of ≥97% to <100%, and 100% sequence identity. The results are shown for GI and non-GI genes. The data were classified into comparisons between strains isolated from the same site (left) and comparisons between strains isolated from different sites (right). (B) For pairwise comparisons between strains, the proportion of genes exhibiting 100% sequence identity is plotted against the average gene similarity in the respective data set. GI genes exhibit an elevated number of identical genes at similar average gene similarities compared to non-GI genes. Linear regressions are shown for all data with respect to GI genes (y = 136 + 11x, r2 = 0.58) and for all data with respect to non-GI genes (y = 54 + 52x, r2 = 0.99).
