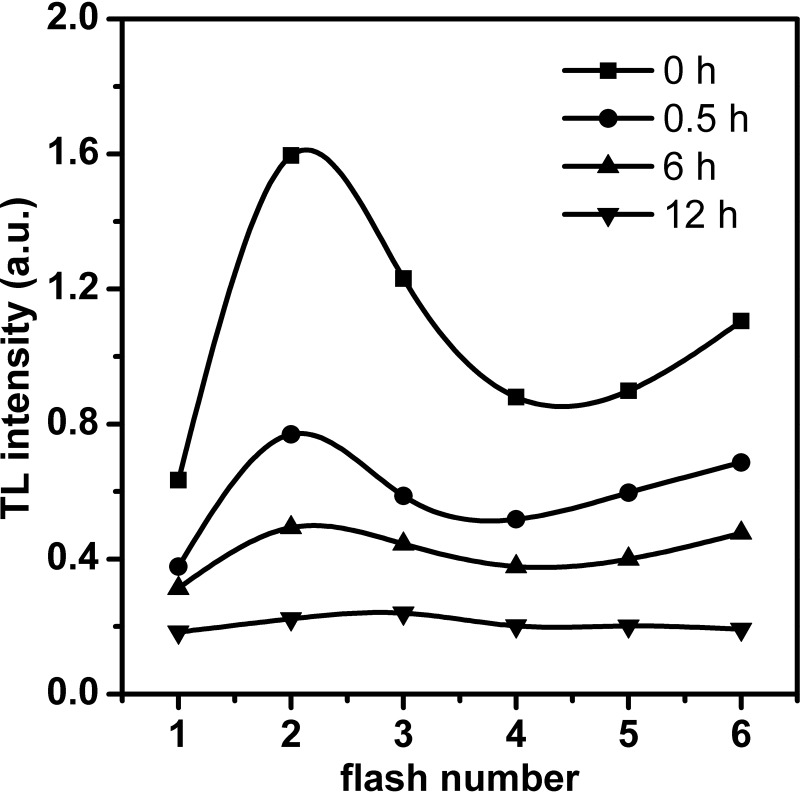
FIG 6.
Flash-induced oscillation of the B thermoluminescence band in Synechocystis cells at different intervals after the addition of 70.4 mM (4×) NO2−. The samples were excited by 1 to 6 single saturating flashes at 0°C, and the intensity of the thermoluminescence B band was measured. The B band intensity (indicated in a.u. [arbitrary units]) is plotted as a function of the number of saturating flashes.

