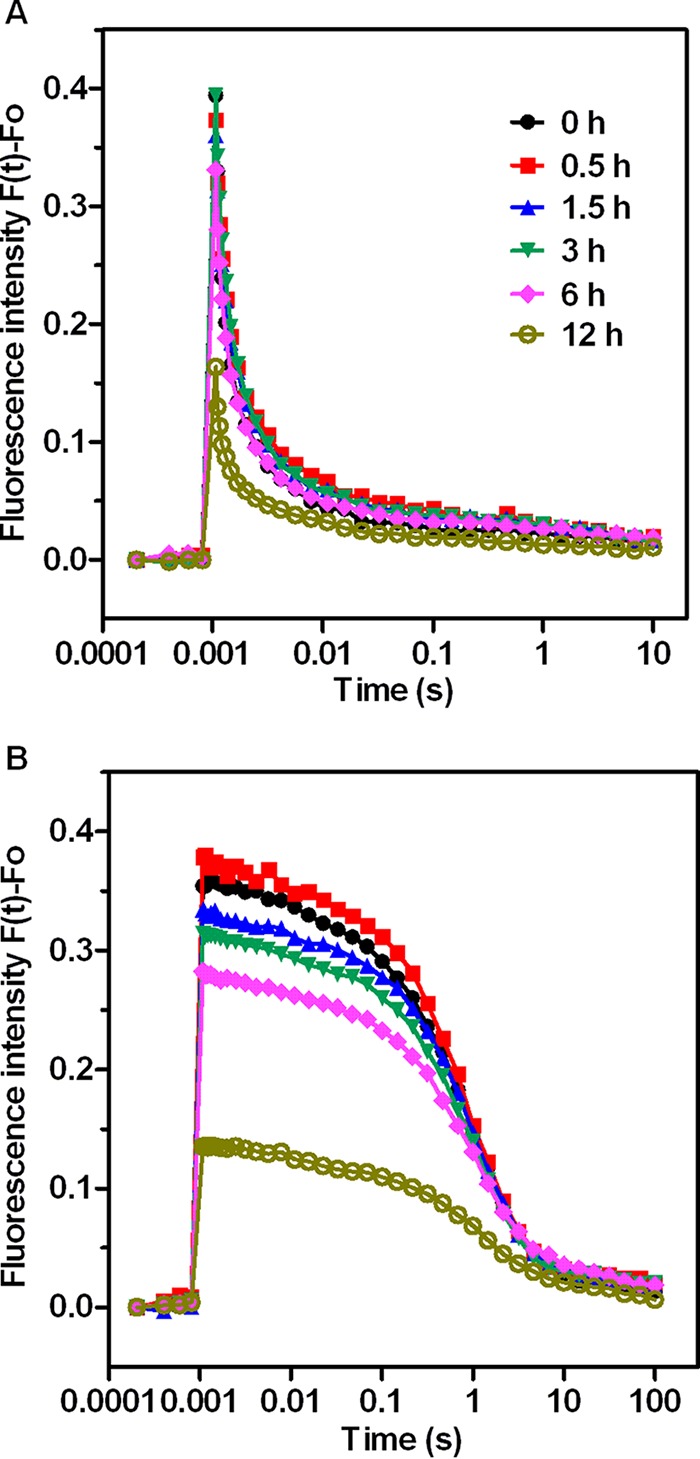
FIG 7.

QA− reoxidation kinetic curves of Synechocystis sp. treated with 70.4 mM (4×) NO2− for various periods of time. (A) Fluorescence decay in the absence of DCMU. (B) Fluorescence decay in the presence of 20 μM DCMU. Each value represents the mean of the results from five replicates.
