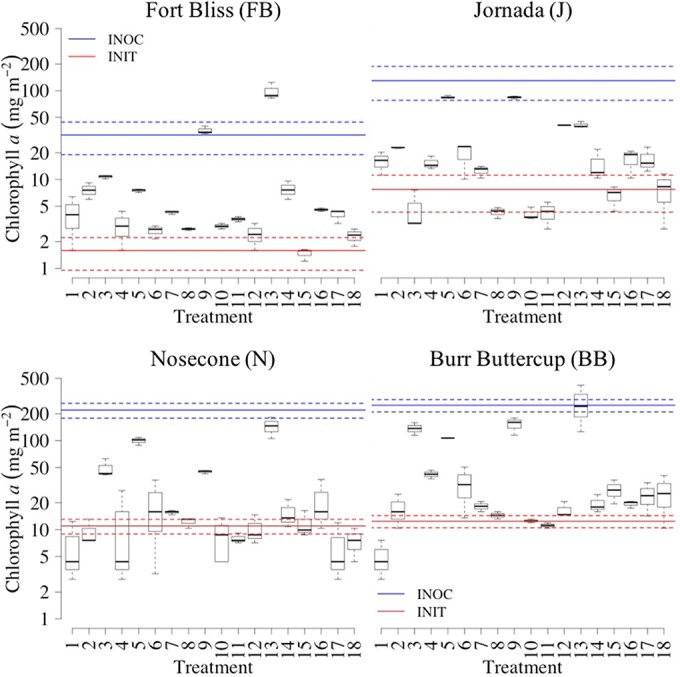
FIG 1.

Boxplots for the final phototrophic biomass (as aerial chl a content) obtained after greenhouse incubation of native soils from 4 sites (each panel shows a site) inoculated with natural biocrusts from their respective site under 18 different treatments. Boxes denote lower and upper quartiles (with median values depicted as black solid lines), and whiskers denote lower and upper extremes (n = 3). Blue lines indicate the chl a content of field biocrust samples used as inoculum (INOC), and red lines indicate initial chl a content in the inoculated soils (INIT) (color solid lines indicate mean, and color dashed lines indicate standard deviations of n = 3).
