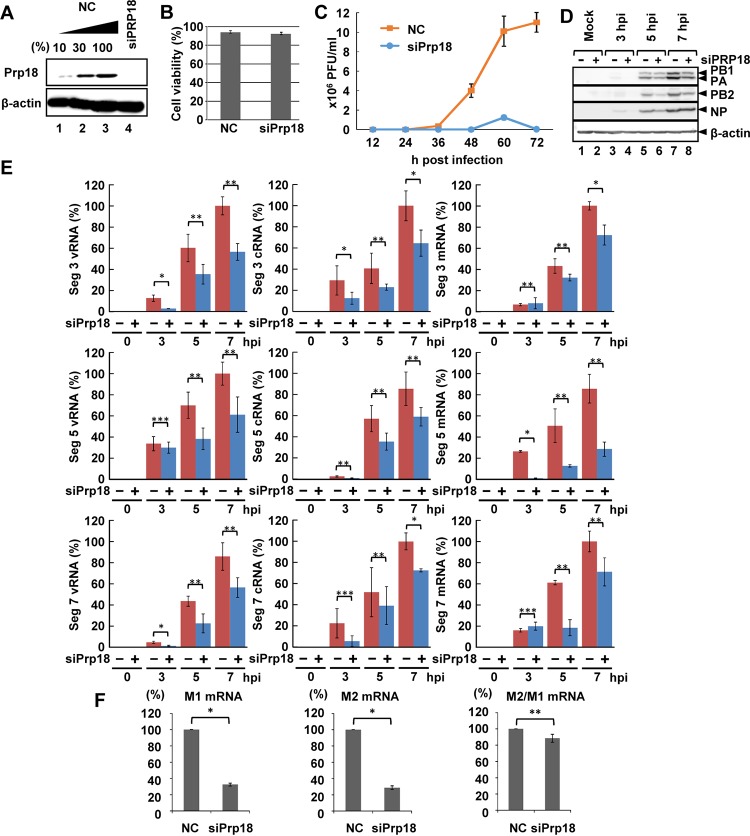
FIG 2.
Effect of Prp18 knockdown on viral RNA synthesis. (A) HeLa cells were transfected with control siRNA or siPrp18. At 72 h posttransfection, cell lysates were subjected to Western blotting using anti-Prp18 and anti-β-actin antibodies. (B) Seventy-two hours after transfection of siRNA, the viability of control and Prp18 KD cells was determined by trypan blue staining. The averages and standard deviations determined from three independent experiments are shown. (C) Seventy-two hours after transfection of siRNA, control and Prp18 KD cells were infected with influenza virus at an MOI of 0.01. The culture supernatants collected at 12, 24, 36, 48, 60, and 72 hpi were subjected to plaque assays to examine the production of infectious virions. The average titers and standard deviations determined from three independent experiments are shown. (D) Seventy-two hours after transfection of siRNA, control (lanes 1, 3, 5, and 7) and Prp18 KD (lanes 2, 4, 6, and 8) cells were infected with influenza virus at an MOI of 3. At 3, 5, and 7 hpi, the cell lysates were subjected to Western blotting with anti-PB1, anti-PB2, anti-PA, anti-NP, and anti-β-actin antibodies. (E) Control and Prp18 KD cells were infected with influenza virus at an MOI of 3 and incubated for 3, 5, and 7 h. Total RNA was prepared from cells, and quantitative RT-PCR was carried out with primer sets specific for segment 3 vRNA, segment 3 cRNA, segment 3 mRNA, segment 5 vRNA, segment 5 cRNA, segment 5 mRNA, segment 7 vRNA, segment 7 cRNA, and segment 7 mRNA. The results were normalized to the level of 18S rRNA. The averages and standard deviations determined in three independent experiments are shown. The level of significance was determined by Student's t test (*, P < 0.01; **, P < 0.05; ***, P < 0.5). (F) HeLa cells were transfected with control siRNA or siPrp18. At 72 h posttransfection, cells were infected with influenza virus at an MOI of 3 and incubated for 5 h. Total RNA was prepared from cells, and quantitative RT-PCR was carried out with primer sets specific for M1 mRNA and M2 mRNA. The results were normalized to the level of 18S rRNA. The ratio of the amount of M2 mRNA to that of M1 mRNA was also determined in three independent experiments, with standard deviations. The level of significance was determined by Student's t test (*, P < 0.01; **, P < 0.05).

