
FIG 1.
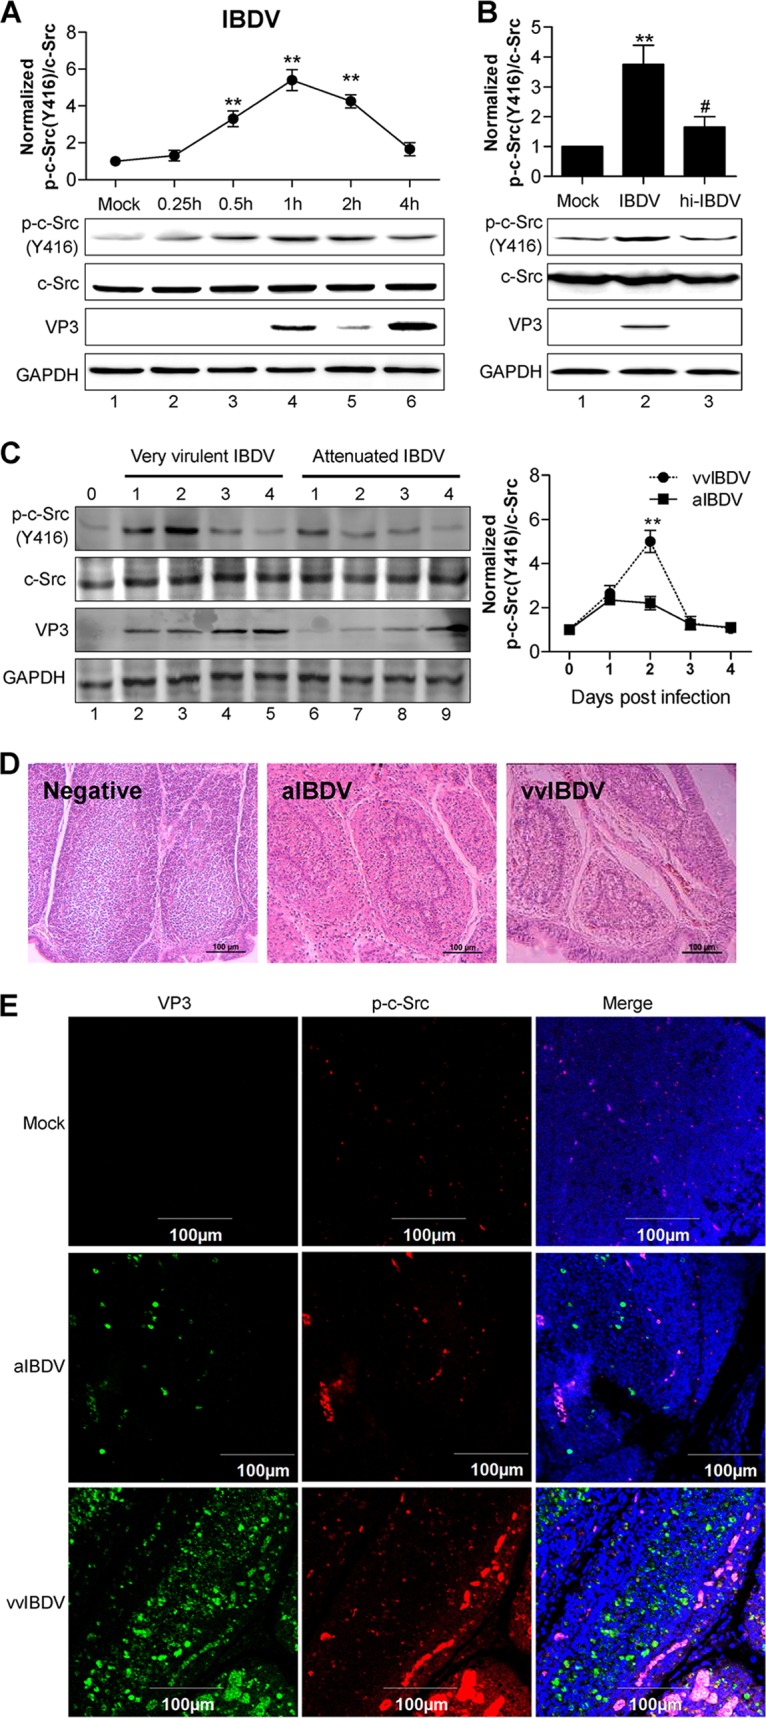
IBDV infection elicits host c-Src tyrosine phosphorylation and activation in a cell line and in vivo. (A) Time course of c-Src Y416 phosphorylation upon IBDV infection. DF-1 cells were either mock infected or infected with IBDV (MOI = 50) for different times (0.25 to 4 h), and Western blot analysis was then performed by using antibodies against phospho-c-Src (Y416), VP3, and total c-Src. GAPDH was used as a loading control. The line graph shows data from densitometry analysis of the ratio of phospho-c-Src/total c-Src. (B) DF-1 cells were mock infected or incubated with live IBDV or with heat-inactivated IBDV for 1 h, and Western blot analysis was then performed by using antibodies against phospho-c-Src, VP3, and total c-Src. The histogram shows data from densitometry analysis of the ratio of phospho-c-Src/total c-Src. (C) SPF chickens inoculated with vvIBDV or aIBDV were sacrificed at the indicated times (days postinfection), and the BFs were collected for Western blotting to analyze the phosphorylation level of c-Src at Y416. (D) H&E staining of BF sections for assessment of pathological lesions. (E) Representative confocal microscopy images of BF sections from SPF chickens inoculated with aIBDV or vvIBDV coimmunostained with anti-VP3 plus anti-mouse Ig Alexa Fluor 488 or anti-phospho-c-Src plus anti-rabbit Ig Alexa Fluor 568, respectively. Nuclei (blue) were stained with DAPI (4′,6-diamidino-2-phenylindole). All the data are presented as means ± SDs from three independent experiments. **, P < 0.01; #, P > 0.05.