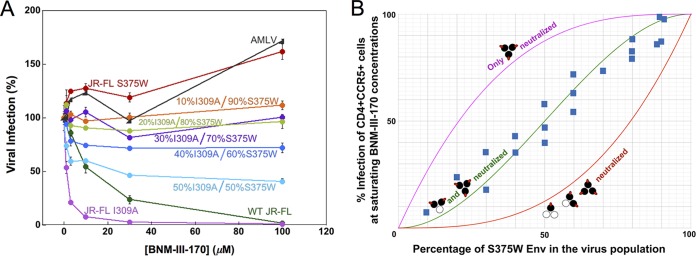
FIG 3.
Inhibition of viruses with mixed Env variants by a CD4mc. Recombinant HIV-1 containing different ratios of the I309A mutant Env and the S375W mutant Env were produced in 293T cells by transfecting the appropriate molar quantities of the Env expressor plasmids. The infectivities of the I309A and S375W mutant viruses for Cf2Th-CD4/CCR5 target cells were comparable to that of the wild-type HIV-1 (data not shown). The I309A change in the gp120 V3 region slightly increases HIV-1 sensitivity to BNM-III-170 inhibition. The S375W change fills the gp120 Phe 43 cavity, rendering HIV-1 resistant to the CD4mc BNM-III-170. (A) Recombinant luciferase-expressing HIV-1 strains with different ratios of I309A-S375W Envs were used to infect Cf2Th-CD4/CCR5 cells in the presence of increasing concentrations of BNM-III-170. The viruses were incubated with BNM-III-170 for 30 min at 37°C and then added to the Cf2Th-CD4/CCR5 cells. The level of infection 48 h later was determined by measuring luciferase activity in the target cells. The level of infection is reported as a percentage of the level of infection observed for a given virus in the absence of the CD4mc. Recombinant HIV-1 pseudotyped with the AMLV Env was included as a control virus. WT, wild type. The error bars indicate standard deviations. (B) Hypothetical inhibition curves showing the level of HIV-1 infection expected at saturating concentrations of the CD4mc BNM-III-170 as a function of the percentage of the CD4mc-resistant S375W Env in the virus population. The magenta curve represents the hypothetical levels of infection expected if only Envs with all three protomers bound by CD4mc are neutralized, the green curve depicts the hypothetical levels of infection expected if only Envs with two or three protomers bound by CD4mc are neutralized, and the red curve shows the levels expected if the Env is neutralized by any bound CD4mc. The blue squares represent the actual experimental data obtained for mixtures of HIV-1JR-FL S375W and I309A Envs at saturating concentrations (typically 30 μM) of BNM-III-170. Each data point represents the results of a single experiment like that shown in panel A and indicates the percentage of the level of infection observed for a given virus at saturating BNM-III-170 concentrations relative to the level of infection seen in the absence of the CD4mc. The results of multiple independent experiments with different virus preparations are shown.

