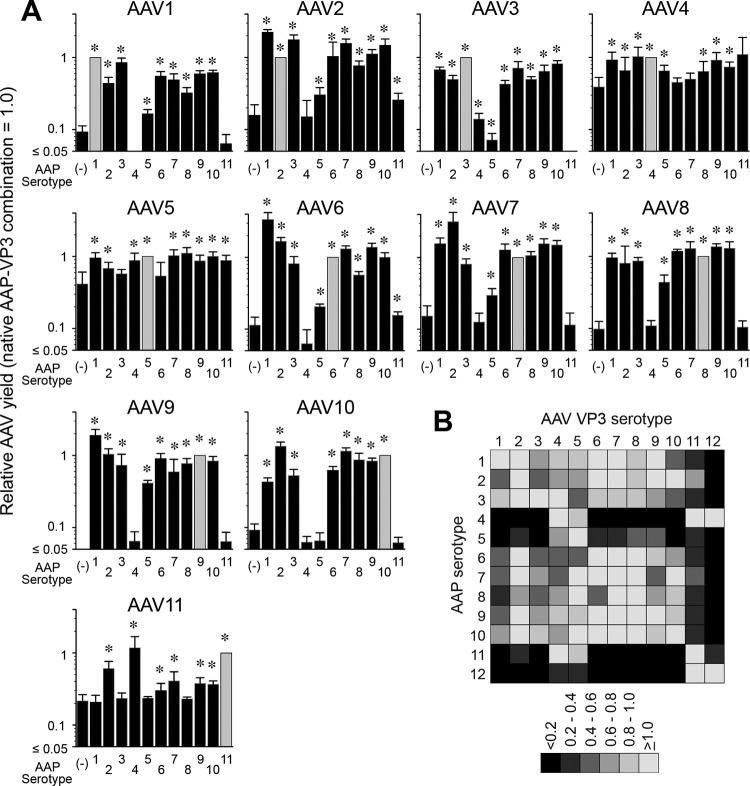
FIG 9.
AAP-VP3 cross-complementation among 12 different AAV serotypes. (A) Data from AAV barcode-Seq analysis showing the ability of each AAP to assemble homologous and heterologous VP3 proteins derived from AAV1 to -11. No-AAP controls are shown as AAP (−) to the left of each panel. The y axis shows AAV VP3-only particle yields in each AAP-VP combination relative to the yields obtained with the native AAP-VP3 combination. The values obtained with the native combination are set as 1.0. The data were collected from an experiment performed in biological triplicates. Error bars represent standard deviations. Asterisks indicate that values are higher than those for the no-AAP controls with a P value of <0.05 (one-tailed Mann-Whitney U test). (B) Matrix heat map showing the ability of each AAP to cross-complement assembly. The data for AAV1 to -11 were obtained from the data shown in panel A. The data for AAV12 were obtained by a quantitative dot blot assay in an experiment performed in biological duplicates. The values obtained by the native combination are set as 1.0.

