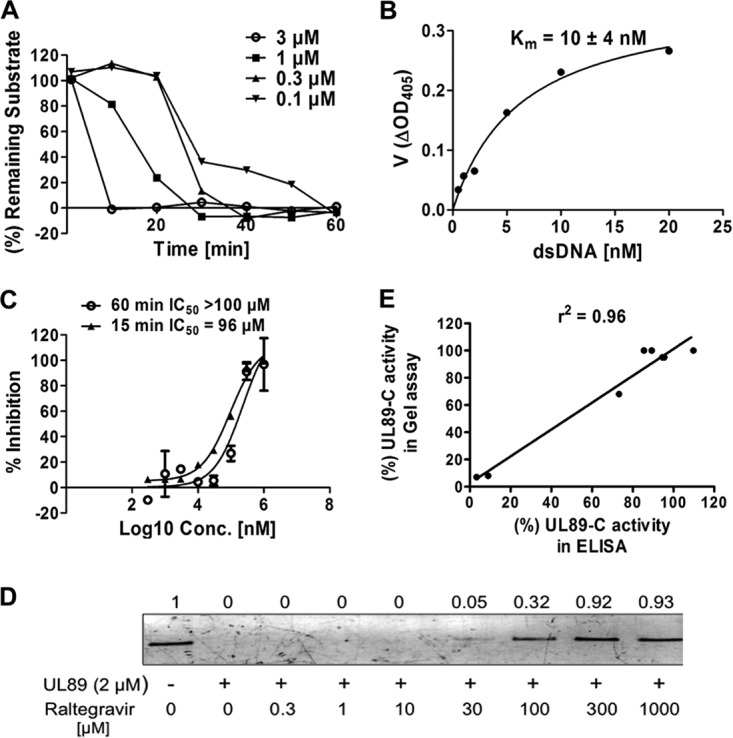
FIG 2.

Establishment of an ELISA to evaluate the anti-pUL89-C activity of compounds. (A) Time course for an ELISA using different concentrations of pUL89-C and 10 nM the substrate. (B) Representative graph for the determination of substrate Km values. Experiment were performed two independent times, and mean Km values plus standard deviations are shown. ΔOD405, change in the optical density at 405 nm. (C) Inhibitory effects of raltegravir on pUL89-C activity analyzed by an ELISA. Results included stopping the reaction at 15 or 60 min. (D) Inhibitory effects of raltegravir on pUL89-C activity analyzed by an agarose gel assay. Shown is linearized pUC18 in the absence (lane 1) or presence (lane 2) of pUL89-C. Lanes 3 to 10 show a range of concentrations of raltegravir with pUL89-C. Numbers above bands correspond to the fold change compared with the control. (E) Correlation between the inhibitory response in a gel assay and the inhibitory response in an ELISA (r2 = 0.96). Intensities of gel bands were determined by using ImageJ and used to calculate percent activity in a gel assay. These values were plotted along with percent activity in an ELISA. The best-fit line and r2 values were determined by using linear regression analysis with GraphPad Prism software.
