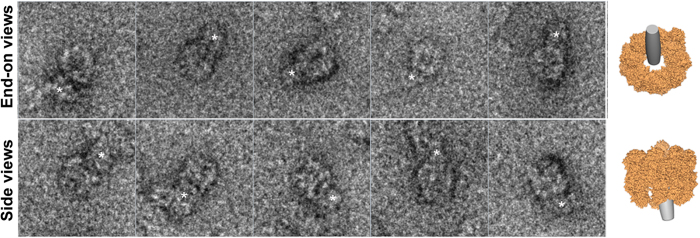
Figure 5. TEM views of CCT-α-syn A53T oligomers.
Gallery of representative end-on (top) and side (bottom) views of the complexes eluted at 8 ml from a Superose 6 column HR 10/30. The end-on views show the donut shape of the cavity formed by CCT subunits; side views show the chaperonin double-ring structure with the characteristic striated barrel shape. The electron density corresponding to the mass of the oligomers bound to CCT is labelled with asterisks. To aid interpretation of electron microscopy images, cartoons (right) show end-on and side views of a model of CCT (pdb 4B2T) bound to a voluminous oligomer, depicted as a cylinder.

