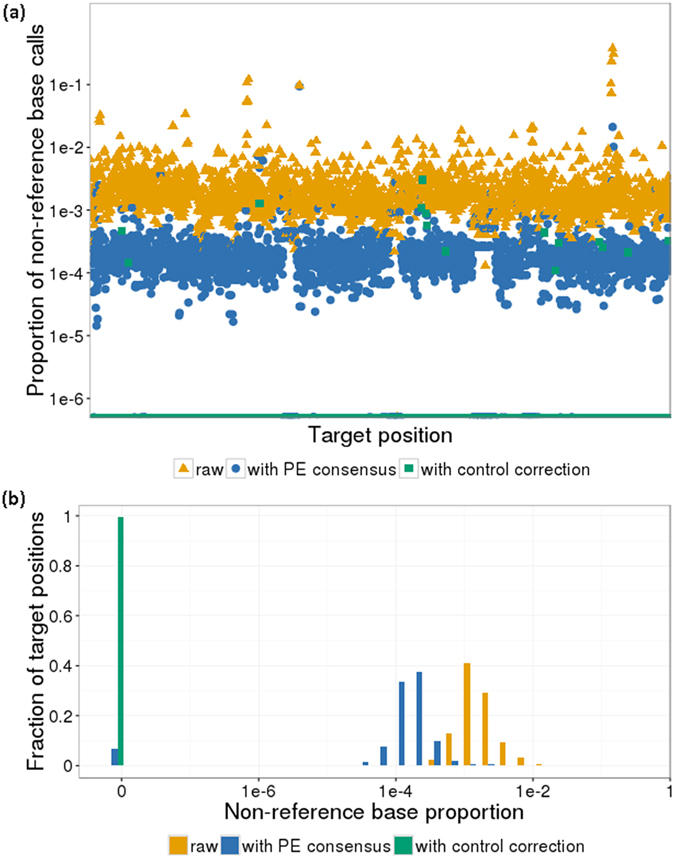
Figure 2. Error correction reduces non-reference base calls in negative (healthy) samples.

(a) Using paired-end consensus calling (blue, circles) and removal of noise as modelled in control samples (green, squares), the non-reference base call proportion is reduced from raw calls (orange, triangles). Points are plotted as the average of 3 samples over each target position (2619 bp after sites of common variation were removed), with zero-value points at the bottom. (b) Histogram representation of the data in (a).
