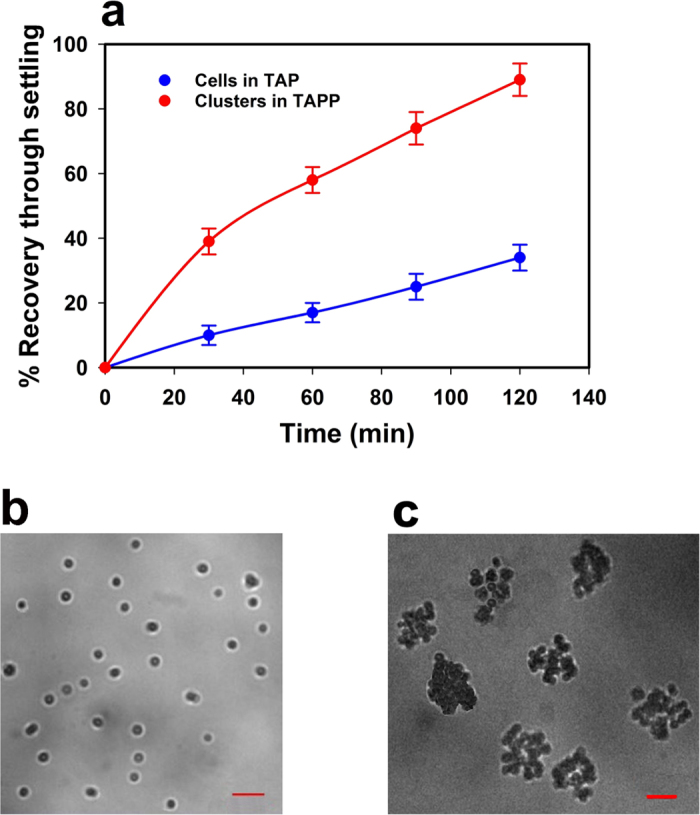
Figure 5. Characterization of microalgal settling.

(a) Percentage of microalgal biomass recovery through settling determined through results from optical density measurements at regular intervals. Data points represent means of 30 measurements and error bars are one S.D. (b) Image of microalgal cells in the well-mixed TAP medium and (c) image of microalgal cell clusters in the TAPP medium. Scale bars are 50 μm.
