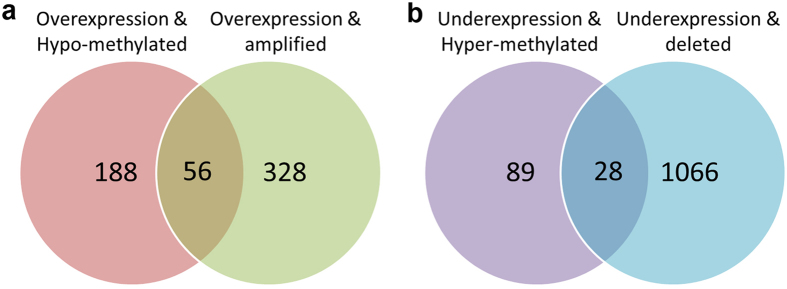
Figure 1. Number of genes with either genetic or epigenetic alterations.
(a) Venn diagram shows the common overexpressed and hypomethylated genomic signatures vs overexpressed and amplified genes. (b) Venn diagram shows the common under-expressed and hypermethylated genomic signatures vs under-expressed and deleted genes.

