Figure 4.
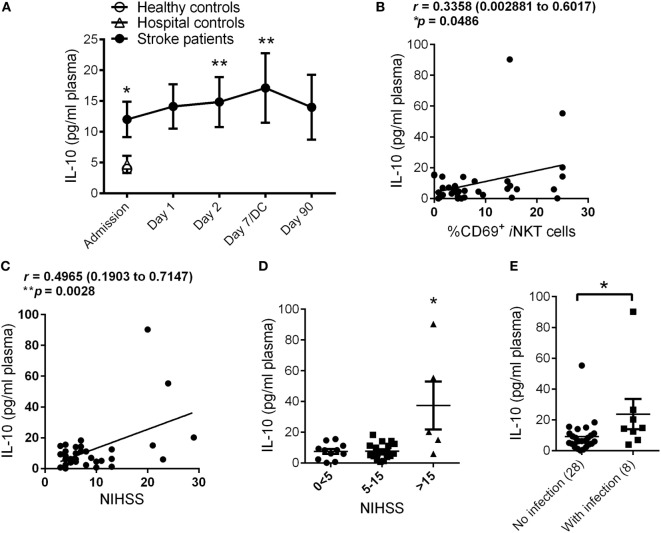
Stroke-induced production of interleukin (IL)-10. The plasma levels of IL-10 in Healthy (n = 10) and Hospital (n = 9) controls as well as stroke patients at Admission (n = 36) and 1 day (n = 36), 2 days (n = 36), 7 days (or at discharge, DC; n = 14), and 90 days (n = 27) after stroke onset were measured (A). Error bars, SEM. **p < 0.01, *p < 0.05 vs Hospital controls, unpaired two-tailed Student’s t-test. Correlation coefficient was calculated between plasma IL-10 levels and invariant natural killer T (iNKT) cell activation (B) and National Institute of Health Stroke Scale (NIHSS) (C) at Admission. Pearson’s correlation coefficient (r) with 95% confidence interval expressed in brackets. Plasma level of IL-10 at Admission was measured in stroke patients with different NIHSS (D). Error bars, SEM. *p < 0.05, one-way ANOVA with Kruskal–Wallis test. Plasma level of IL-10 at Admission was measured in stroke patients who later developed poststroke infection (E). Error bars, SEM. *p < 0.05 vs no infection, unpaired two-tailed Mann–Whitney U test.

