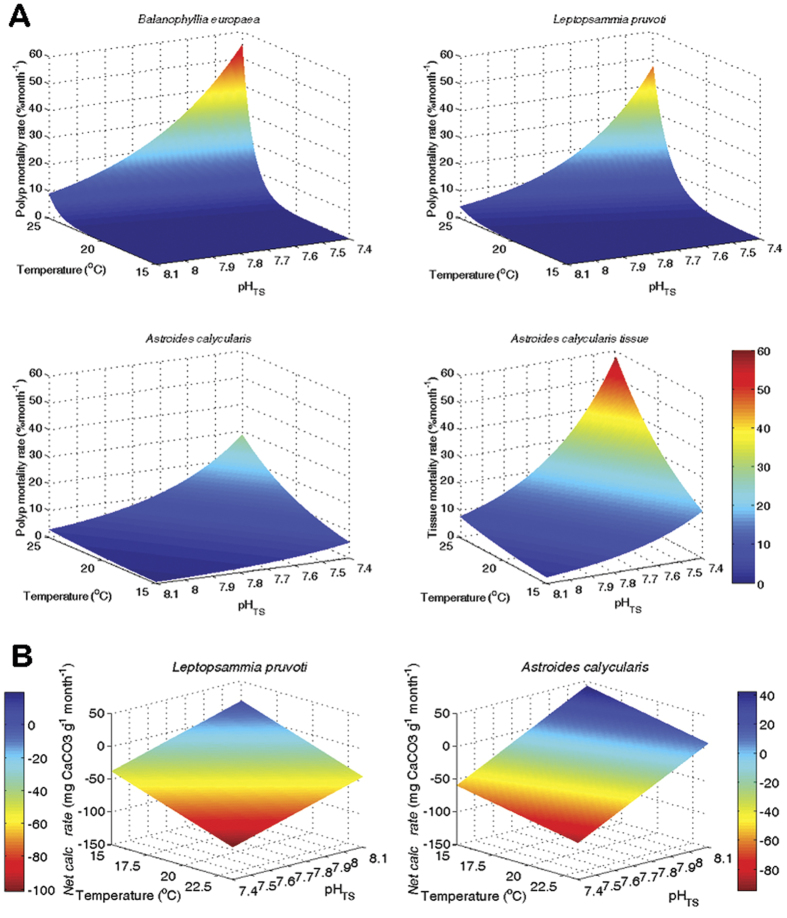
Figure 2. Plots of the three-dimensional functions obtained by regressions of mortality and net calcification rates for B. europaea, L. pruvoti, and A. calycularis against pHTS and sea water temperature (°C), using the regression parameters in Table 1B.
(A) 3-D plots of mortality rates (% month−1) (GLM log link functions). Polyp mortality rate for B. europaea, L. pruvoti, and A. calycularis and coenosarc-polyp tissue mortality for the latter. (B) 3-D plots of net calcification rates (mg CaCO3 g−1 month−1) (OLS linear functions). The plot for B. europaea is not reported because the fit in Table 1B showed no relationship with SWT and pHTS.

