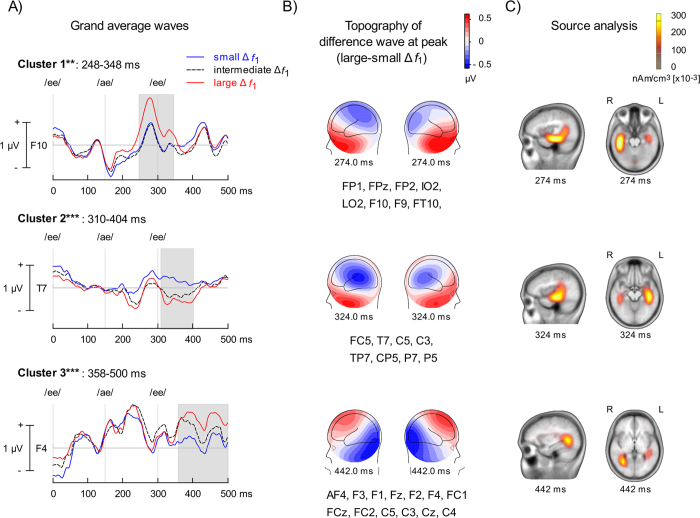
Figure 5. Adaptation phase.
(A) Group mean event-related potentials (ERPs) time-locked on triplet onset when the difference between the first formant (Δf1) was small (blue) or large (red). Vertical lines indicate the onsets of the corresponding vowel in the triplet. Note that baseline correction was applied prior to the /ae/ vowel rather than triplet onset to emphasize transient changes in neural activity following the changes in Δf1. Three ERP modulations (i.e., clusters) were identified. The third cluster shows difference at the triplet onset, which likely reflects residual Δf1-related changes in ERP amplitude from the previous triplet. Each panel shows the recording site (i.e., electrode) where the difference was largest for each cluster. The shaded area reveals the time window that was significantly different within each cluster. (B) Left and right views of iso-contour maps showing the peak of the ERP modulation as revealed by the difference in ERPs elicited by small and large Δf1. The electrodes showing significant effects of Δf1 are listed below the contour maps. The blue color refers to negative voltage while the red color indicates positive voltage. (C) Cortical Low resolution electromagnetic tomography Analysis Recursively Applied (CLARA, BESA version 6.1) at each peak activity identified in the cluster analysis. **p < 0.01, ***p < 0.001.

