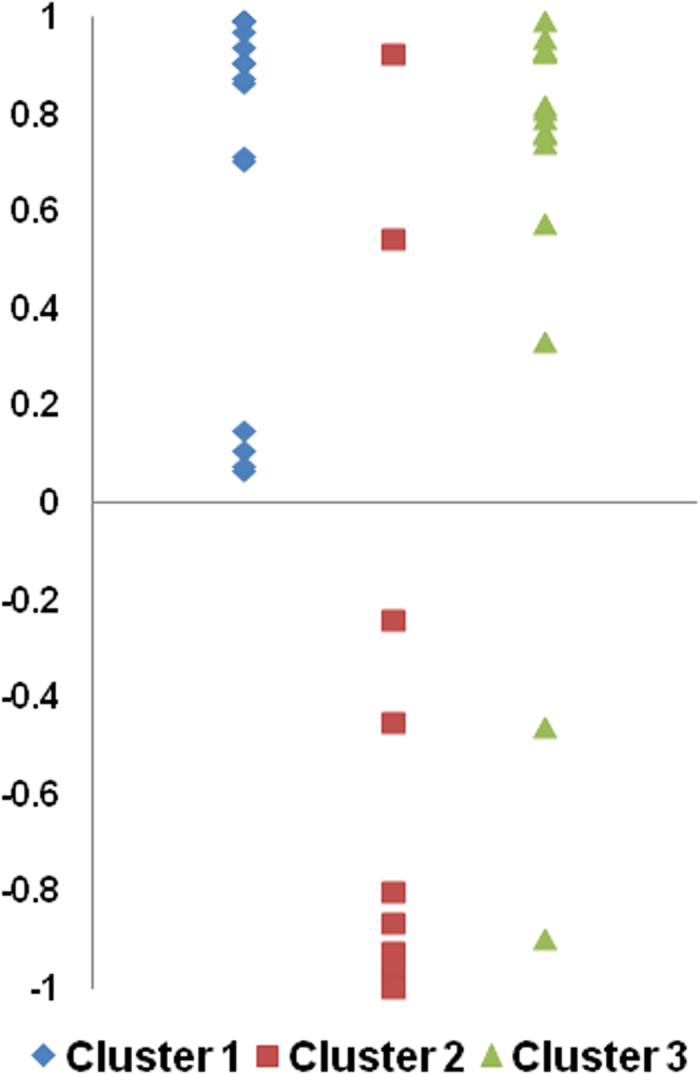
Figure 7. Scatterplots displaying the Pearson correlations (y axis) between participants’ perception of streaming and event-related potential (ERP) mean amplitude for the adaptation sequence.

For each cluster, the mean amplitude measurements (50 ms centered on the peak latency) included all electrodes from the cluster (see Fig. 5).
