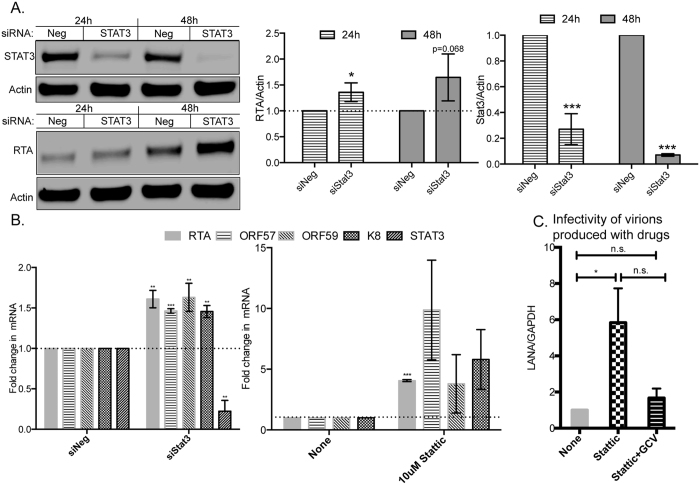
Figure 7. STAT3 repression in BCBL-1 cells facilitates entry into the lytic phase of the KSHV life cycle.
(A) BCBL-1 cells were electroporated with siRNAs targeting STAT3 or control siRNA for 24 or 48 hours, following which the cells were harvested for Western blot analysis (A) or qRT-PCR (B). (A) The protein levels of STAT3 (top) or RTA (bottom) were normalized to that of actin and plotted on the right. B. qRT-PCR was performed 24 hours post-electroporation of siSTAT3 (left) or Stattic-treatment (right) and levels of viral lytic mRNAs (RTA, ORF57, ORF59 or K8) and STAT3 were measured by qRT-PCR. GAPDH was used as an internal control. (C) KSHV virions were purified from BCBL-1 cells left untreated, treated with Stattic or Stattic+GCV and then used to infect HUVECs for 3 days. LANA mRNA levels in infected HUVECs were measured using qRT-PCR, normalized to that of GAPDH, and analyzed by ANOVA. Full-length blots are in Figure S3.

