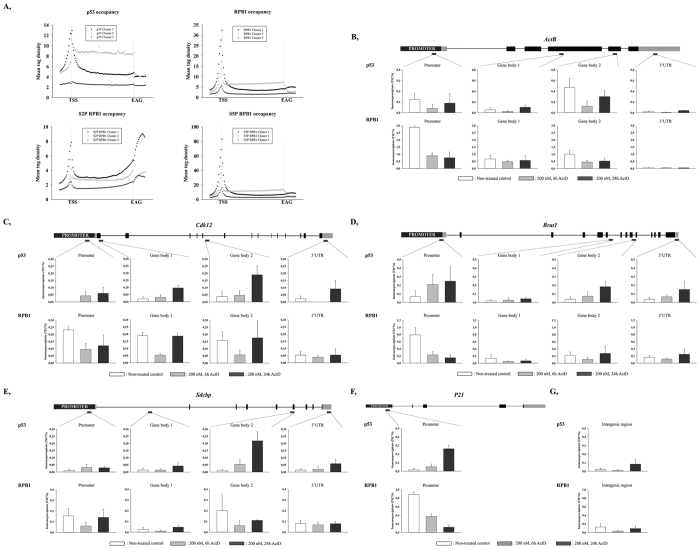
Figure 5. Human p53 binds to regions of genes which are not its direct targets.
(A) ChIP-seq analysis of p53, RPB1, S2P RPB1 or S5P RPB1 occupancies results in the classification of 3 gene clusters. (B–E) p53 and RPB1 occupancies at the promoter, proximal (Gene body 1) and distal (Gene body 2) gene body and 3’UTR of ActB, Cdk12, Brat1, Sdcbp genes, respectively. On each graph, white columns represent untreated control, while grey and black columns indicate samples treated with 200 nM ActD for 6 and 24 h, respectively. The schematic structure for each gene and the location of the products amplified with qPCR are indicated. (F) For the positive control, p53 and RPB1 occupancies at the promoter of P21, a direct target gene of p53, are shown. (G) p53 and RPB1 occupancies at an intergenic region, which was used as a negative control. Each data point represents the average of measurements taken on two independent chromatin samples.

