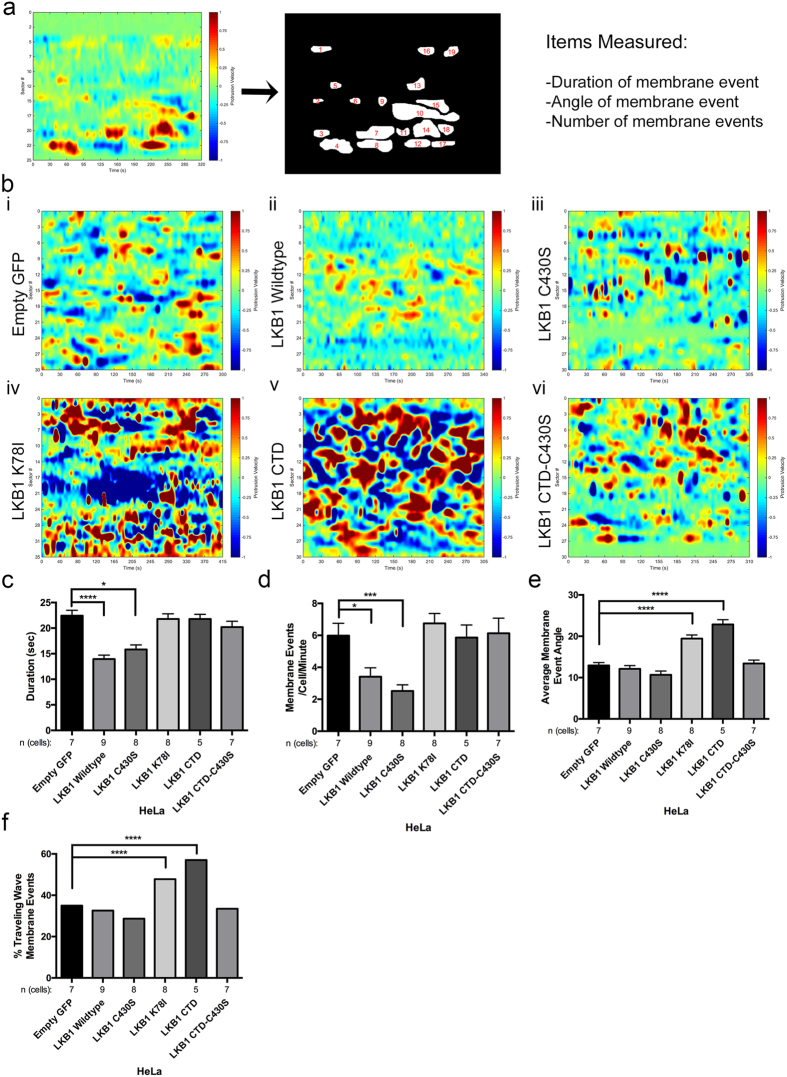
Figure 4. LKB1 kinase activity regulates cell membrane dynamics.
(a) Membrane protrusion (red) and retraction (blue) events were measured around the cell periphery using the same CADE analysis as in Fig. 3c. Cell boundary sectors are on y-axis, time is on x-axis. Protrusion and retraction events were manually identified and the duration, angle, and number of membrane events/cell/minute was quantified. (b) (i) CADE analysis on empty GFP control cells. (ii–vi) CADE analysis on LKB1 and the various LKB1 mutants. (c) Duration of membrane events (seconds). (d) Average number of membrane events/cell/minute. (e) Average membrane event angle. (f) Percent of membrane events exhibiting traveling waves, defined as an angle greater than 10°. In parts (c–e), a Kruskall-Wallis test with a p-value of 0.05 showed statistical significance. Significance was then measured between comparisons using Dunn’s multiple comparisons test with a p-value of 0.05. In part (f), significance was measured using a 2-tailed Chi-squared analysis with a p-value of 0.05. *p ≤ 0.05; ***p ≤ 0.001; ****p ≤ 0.0001. Error bars = SEM.

