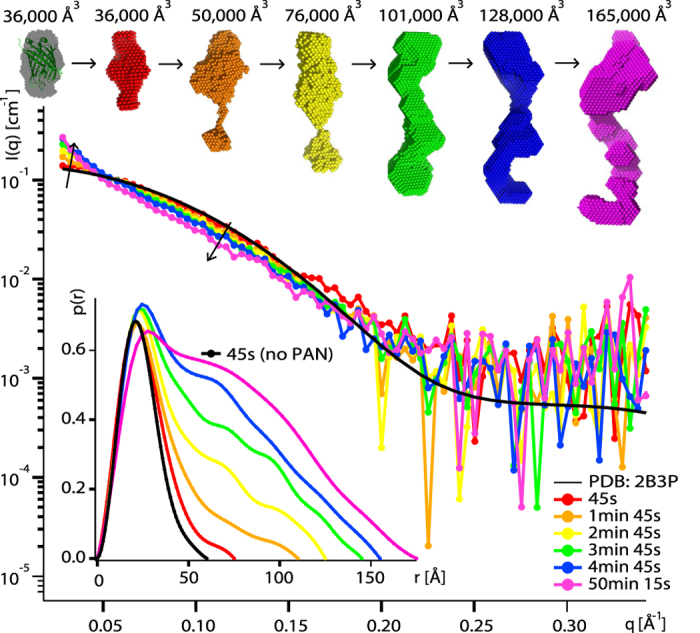
Figure 2. GFPssrA is released and aggregates in solution after unfolding by PAN.

Middle: SANS curves recorded on deuterated (d) dGFPssrA (2 mg/ml) in the presence of hydrogenated (h) hPAN (10 mg/ml) and ATP (100 mM) in a 42% D2O buffer (hPAN invisible) at 55 °C during the unfolding reaction. The back-calculated SANS curve (CRYSON35) from the GFP crystal structure (PDB ID 2B3P) is shown as a black continuous line. Top: ab initio envelopes of dGFPssrA at different times and the respective volumes of each model. The first model (grey) is generated from SANS data without hPAN (control experiment, see Fig. S3) and is superimposed with the crystal structure. Bottom left: pair distance distribution functions, P(r), calculated using GNOM46.
