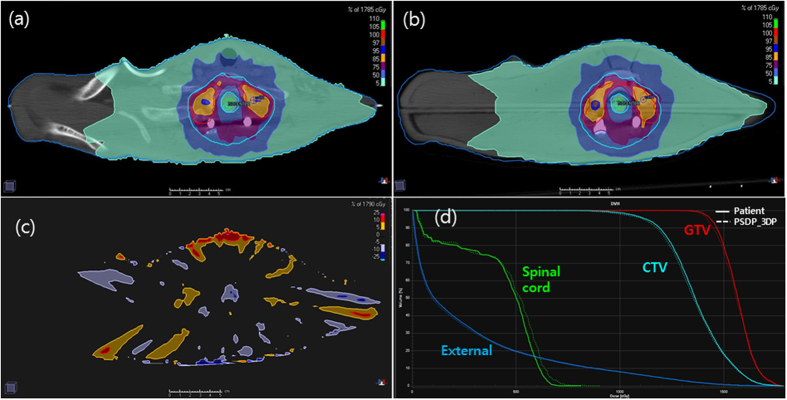
Figure 3.
Plans for the patient (a) and PSDP_3DP (b) showed very similar dose distributions in the axial plane. Larger dose differences were observed at the border of the external body contour (low-dose region), but was minimal in the center region (high-dose region), the difference of which was within 5% according to an axial dose difference map (c). The DHVs of the both plans were well matched (d).

