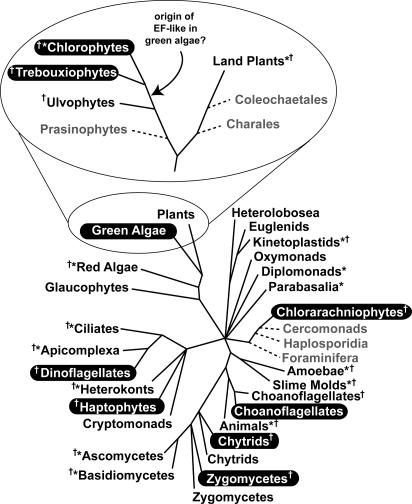
Fig. 2.
Distribution of EFL and eEF-1α in eukaryotes. Hypothetical synthesis of eukaryotic relationships based on many molecular and structural characteristics. Groups with canonical eEF-1α are shown in black text. Groups where EFL but no canonical eEF-1α is known are highlighted by white text on black. Groups with no EF data are shown in gray text with dashed lines. Eukaryotic groups where the EF-1α/EFL distribution is supported by substantial or complete-genome data are indicated by asterisks, and support from ESTs is indicated by a cross. The expanded view of plants and green algae shows details of the distribution and the possible origin of the EFL gene in this group.

