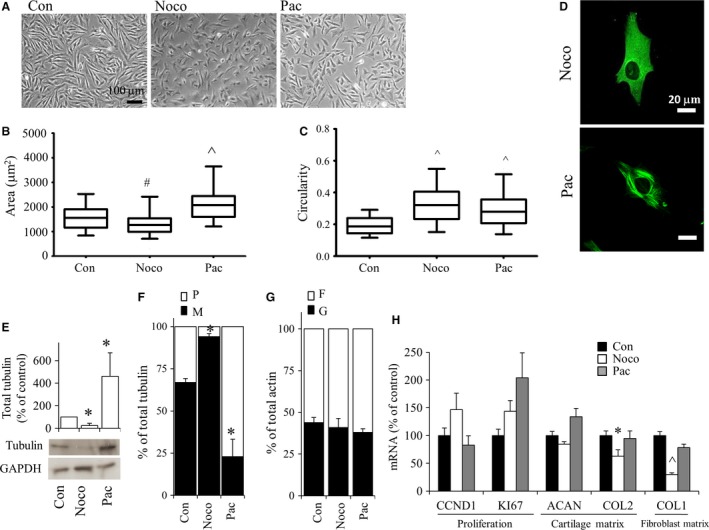
Figure 3.

Bovine P2 chondrocytes were cultured in monolayer for 3 days and then exposed to either nocodazole or paclitaxel and evaluated 24 h after treatment. (A) Cell morphology by phase contrast microscopy. Areas (B) as well as circularity (C) of cells were evaluated using image analysis software. Box plots represent mean, 25% and 75% quartile, and whiskers represent the 95% confidence intervals. (D) Tubulin organization was examined by confocal microscopy. Green indicates tubulin. Blue indicates DAPI localized in the nucleus. Scale bar: 20 μm. (E, F) Western blots using anti‐tubulin demonstrated (E) total tubulin levels and (F) M‐ and P‐tubulin fractions separated through Triton solubility. (G) Western blots using anti‐actin demonstrated G‐ and F‐fractions separated through Triton solubility. (H) Real‐time relative PCR evaluation of gene expression normalized to 18S rRNA and expressed as percent of DMSO‐control (vehicle only). Bars show the mean ± SEM of three to six independent experiments. *P < 0.05; # P < 0.01; ^P < 0.001, vs. P2 (control) chondrocytes.
