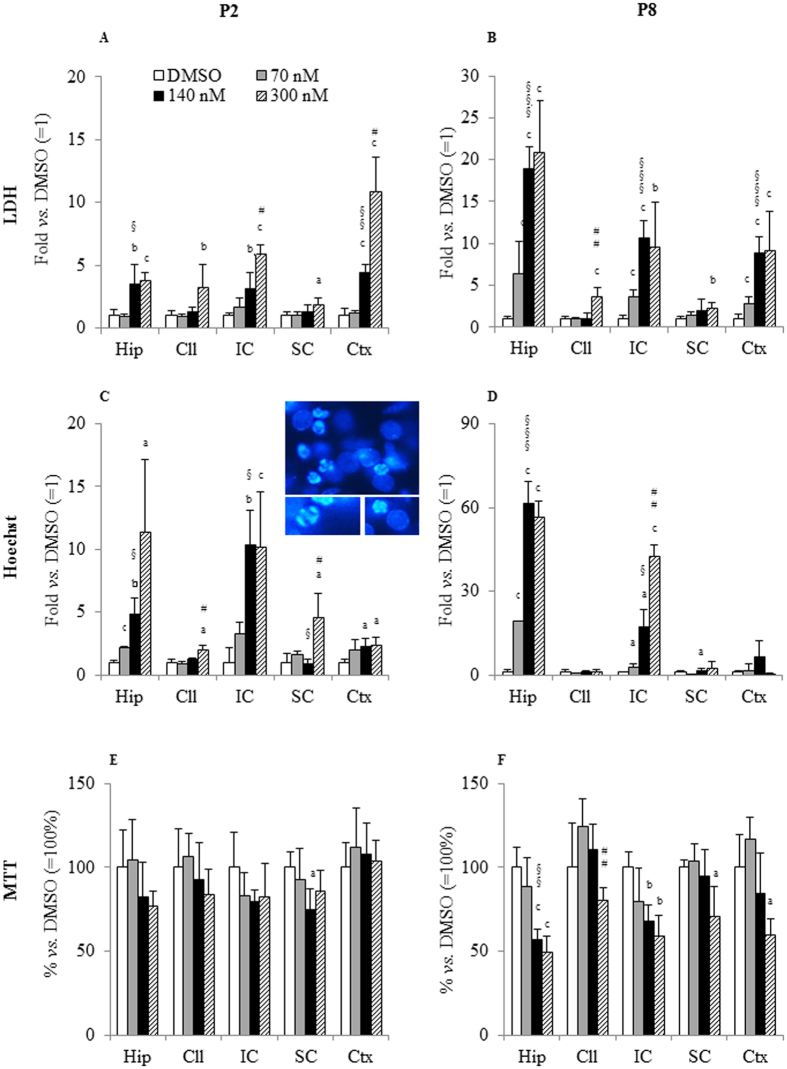
Figure 2. Results of viability tests of P2 and P8 OBCs challenged with 70, 140 and 300-nM Bf.
(A) LDH release in P2 OBCs; (B) LDH release in P8 OBCs; (C) Hoechst staining of P2 OBCs; (D) Hoechst staining of P8 OBCs; (E) MTT assay of P2 OBCs; (F) MTT assay of P8 OBCs. LDH release and Hoechst are expressed as fold change of control (DMSO = 1). MTT is expressed as % change of control (DMSO = 100%). Data are expressed as the mean ± SD of three-five repetitions. Statistical significance: (a) p < 0.05, (b) p < 0.01, (c) p < 0.001 vs. DMSO; §p < 0.05, §§p < 0.01, §§§p < 0.001 70-nM vs. 140-nM; #p < 0.05, ##p < 0.01, ###p < 0.001 140-nM vs. 300-nM. Hip: hippocampus; Cll: cerebellum; IC: inferior colliculus; SC: superior colliculus; Ctx: cortex.

