
Figure 2.
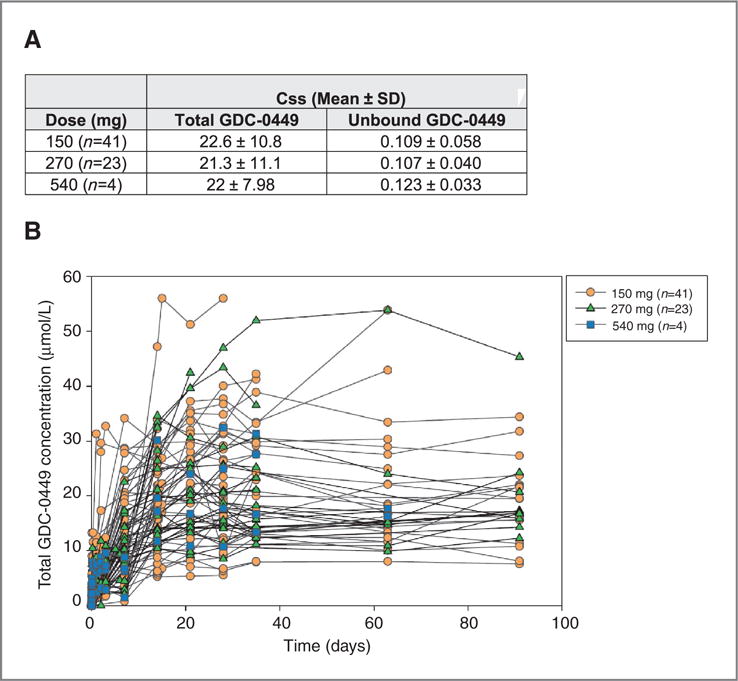
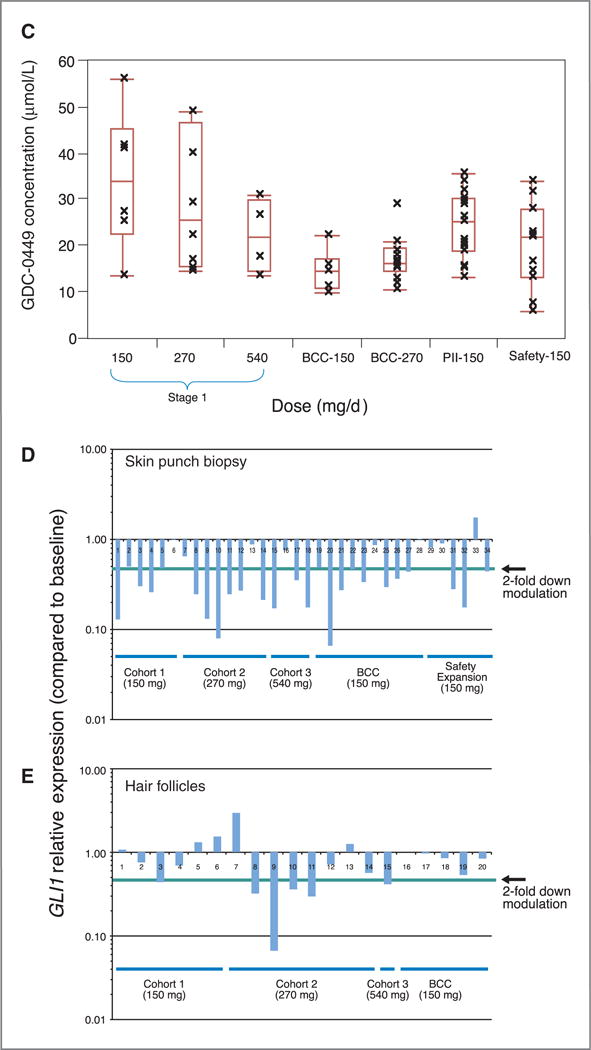
Pharmacokinetics and Pharmacodynamics of GDC-0449. A, steady-state concentrations [Css, mean, and SD] are shown for total and unbound GDC-0449, by dose cohorts. B, Pharmacokinetic plasma concentrations of total GDC-0449 (mmol/L), color-coded by dose cohort, are shown for individual patients over 13 weeks. C, Plots of average GDC-0449 steady state concentrations in the different cohorts. BCC-150 and BCC-270 refer to the cohort of patients with BCC. PII-150 refers to the new GDC-0449 formulation that is being used in phase II studies. The line in the middle of the box represents the median, the top and bottom box limits represent the 25th and 75th percentiles, and the top and bottom bars represent 1.5 times the interquartile range. D and E, Skin punch biopsies or hair follicles were processed for analysis of GLI1 mRNA expression as described in the Methods section. Levels of GLI1 down-modulation, compared with pretreatment patient specimens, are shown for individual patients grouped by dose and staging cohorts.