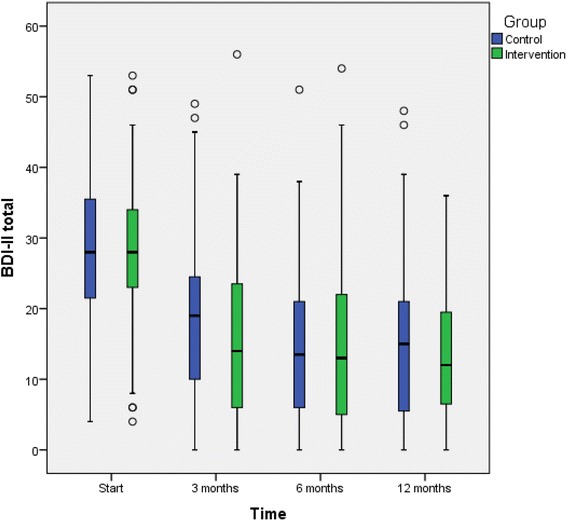
Fig. 2.

Depression severity (BDI-II values) in the intervention and TAU groups. Boxplots for baseline, 3-months follow up, 6-months follow up, and 12-months follow up. The outcome variable is presented as box plot with medians, minimum and maximum values and lower and upper quartiles. Y-axis: BDI-II, X-axis: time 0, 3, 6, 12 months. Outliers (circle) are cases with values between 1.5 and 3 times the interquartile range (5 cases with BDI-II ≥50 in patients with difficulties in Swedish language, where complementary diagnostic procedure by the GP ended up on medium depressive disorder)
