Fig. 6.

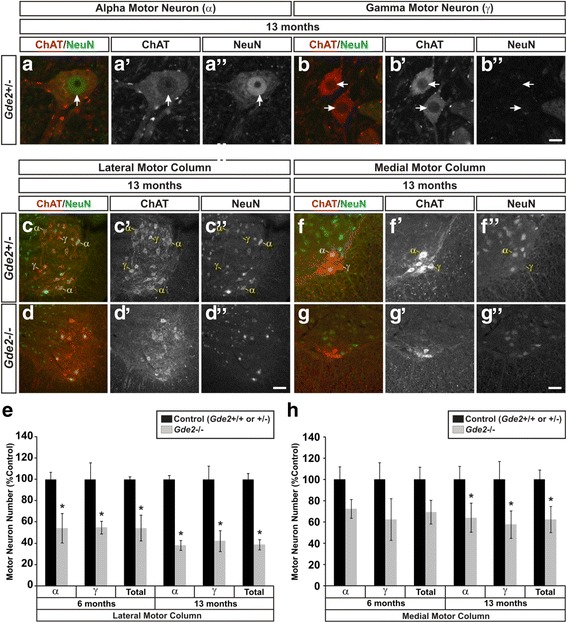
Gde2 KO mice have progressive motor neuron loss. a–b” Example images of alpha (α) and gamma (γ) motor neurons. Alpha motor neurons are ChAT+/NeuN+ while gamma motor neurons are ChAT+/NeuN−. Arrows indicate position of the nucleus. Scale bar = 10 μm. c–d” Representative images of motor neurons in the LMC labeled with ChAT and NeuN at 13 months. Example α and γ motor neurons are indicated. Scale bar = 50 μm. e Quantification of LMC motor neuron loss. 6 months: α *p = 0.001, γ *p = 0.048, Total *p = 0.003, n = 3. 13 months: α *p < 0.001, γ *p = 0.046, Total *p = 0.001, n = 5. f–g” Images of α and γ motor neurons in the MMC at 13 months. h Graph quantifying MMC motor neuron decrements. 6 months: α p = 0.212, γ p = 0.151, Total p = 0.116, n = 3. 13 months: α *p = 0.002, γ *p < 0.001, Total *p = 0.002, n = 5. All graphs represent mean ± SEM, Student’s t test
