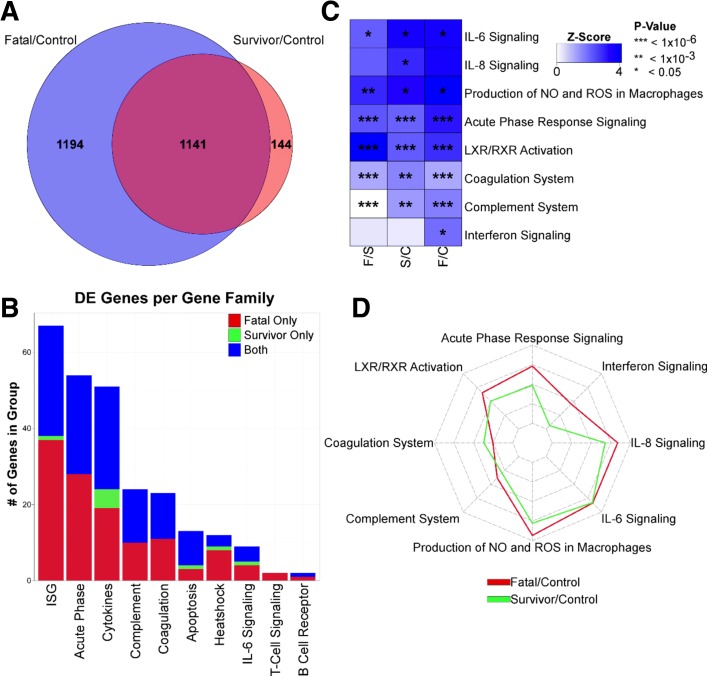
Fig. 2.
Host transcriptional responses in acute EBOV infection. a Venn diagram representing genes that are differentially expressed from control to fatal (blue) and control to survivor (red). Shared genes are shown in magenta. b Histogram illustrating genes increased in abundance in different functional groups. Genes significantly increased in abundance in fatal only (red), survival only (green) or in both (blue) are shown. c Heatmap of pathway upregulation intensity calculated by Ingenuity Pathway Analysis (IPA) for acute-fatal to convalescent control (F/C), acute-survivor to convalescent control (S/C) and acute-fatal to acute-survivor (F/S). Stars within boxes represent calculated p value significance of increased abundance (* < 0.05, ** < 10–3, *** < 10–6). d Spider plot of the z scores from the IPA. Increased abundance in fatal to control is in red, survival to control in green

