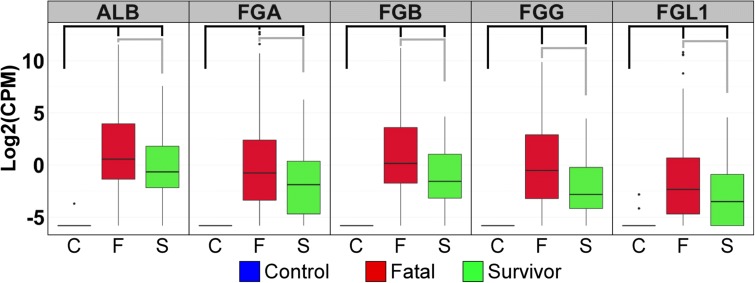
Fig. 3.
Coagulation associated mRNAs accumulate in the blood of EBOV-infected patients. Box and whisker plots illustrate the expression of the top acute phase genes that are differentially expressed between controls (blue), fatal (red), and survivors (green) based on log2 fold change. From left to right, the graphs illustrate mRNA expression for albumin (ALB), fibrinogen alpha (FGA), fibrinogen beta (FGB), fibrinogen gamma (FGG) and fibrinogen gamma-like 1 (FGL1). Black brackets indicate significance between control and survivor or fatal levels and grey brackets indicate significance level between survivors and those who will succumb to disease. All brackets represent a log2(fold change) > 2 and FDR < 5 %

