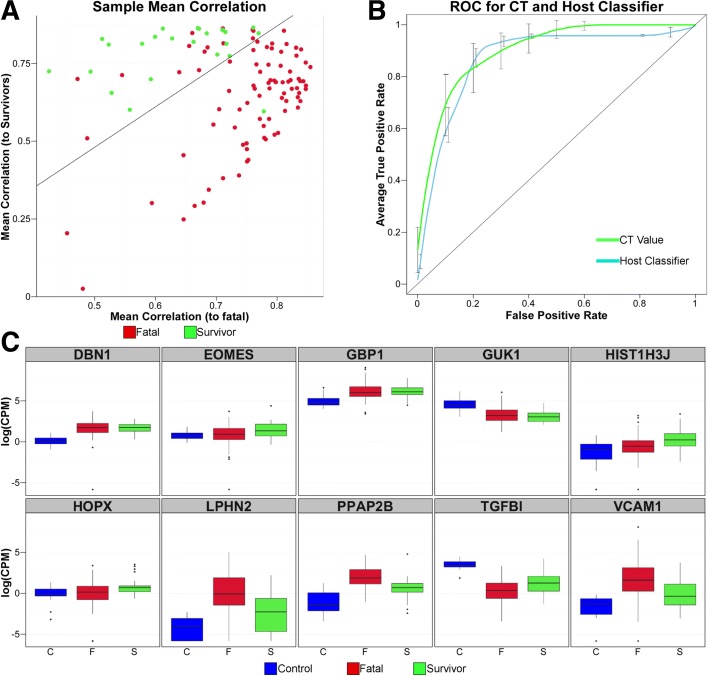
Fig. 6.
Identification and testing of a small set of host mRNAs whose expression predicts survival during acute EBOV infection. a Mean correlation plots where each sample is represented. Survivors in green, fatal in red. Line indicates prediction inflection point. Individuals above the line would be predicted to be survivors using these mRNAs, while individuals below would be predicted to succumb to the disease. b ROC comparing prediction of survival using EBOV PCR Ct value (green) and host mRNA expression classifier (blue). The error bars represent SD of the average true positive rate. c Box and whisker plots illustrating expression changes in log2(CPM) for the ten genes in the Host Classifier in control (blue), fatal (red) and survivors (green)

