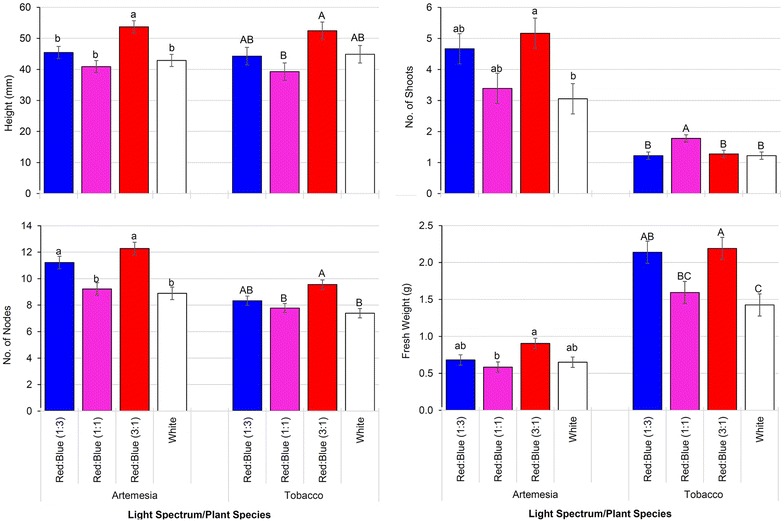
Fig. 5.

Differences in plant height, no. of shoots, no. of nodes and fresh weight measured after 3 weeks of growth of tobacco and artemisia growing under white and red/blue combination with the fluence rate 35 μmol m−2 s−1. Data presented as mean ± SE and different letters in the figures indicate significant differences at α = 0.05 using Tukey’s test (lower and upper case letters are used for artemisia and tobacco, respectively)
