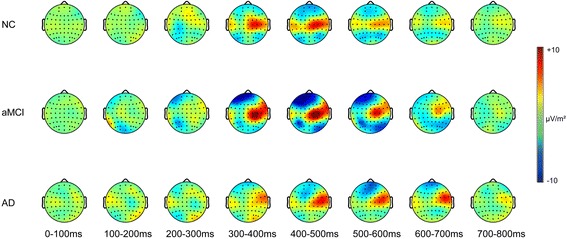
Fig. 3.

The spatial distribution of current source density (in microvolts per square meter) of match/nonmatch effects (formed by subtracting event-related potentials [ERPs] of nonmatch from ERPs of match) in three groups for each 100 milliseconds within 0- to 800-millisecond latency regions. AD Alzheimer’s disease, aMCI Amnestic mild cognitive impairment, NC Normal controls
