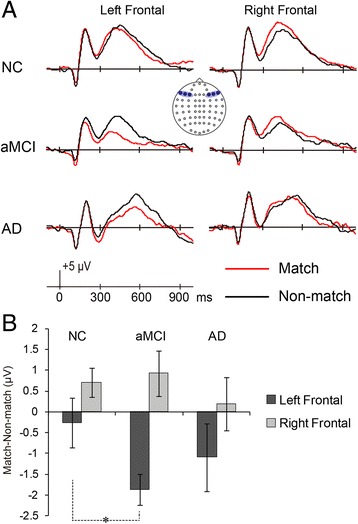
Fig. 4.

a Grand average waveforms from lateral frontal regions elicited by correctly classified match and nonmatch items in three groups. The left frontal (F) region was collapsed across F3, F5, and F7, and the right frontal site was collapsed across F4, F6, and F8. The selected electrode sites are indicated by the inset. b Mean amplitude of match/nonmatch effects (match − nonmatch) at left and right frontal regions (300–600 milliseconds) according to group. Error bars represent SEM. Asterisk denotes significant group difference between NC and aMCI at left frontal region. AD Alzheimer’s disease, aMCI Amnestic mild cognitive impairment, NC Normal controls
