Fig. 3.

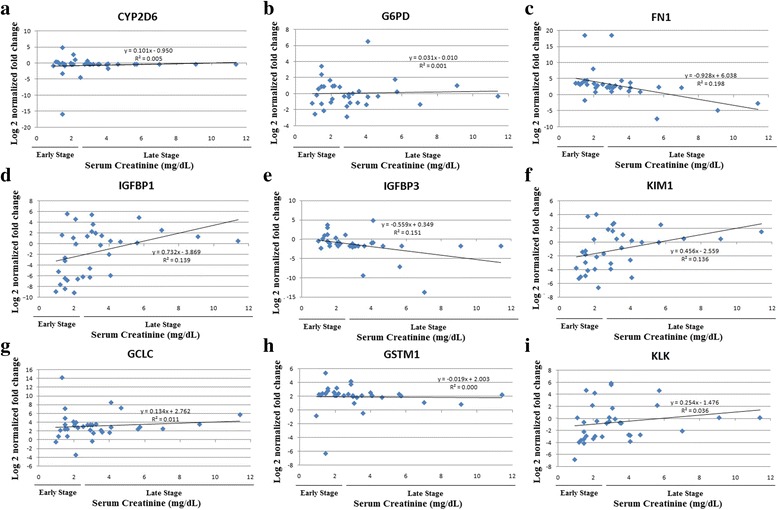
Correlation graphs of serum creatinine with log normalized gene expressions of a CYP2D6; b G6PD, c FN1; d IGFBP1; e IGFBP3; f KIM1; g GCLC; h GSTM1; i KLK1 in CKDu patients

Correlation graphs of serum creatinine with log normalized gene expressions of a CYP2D6; b G6PD, c FN1; d IGFBP1; e IGFBP3; f KIM1; g GCLC; h GSTM1; i KLK1 in CKDu patients