Figure 2.

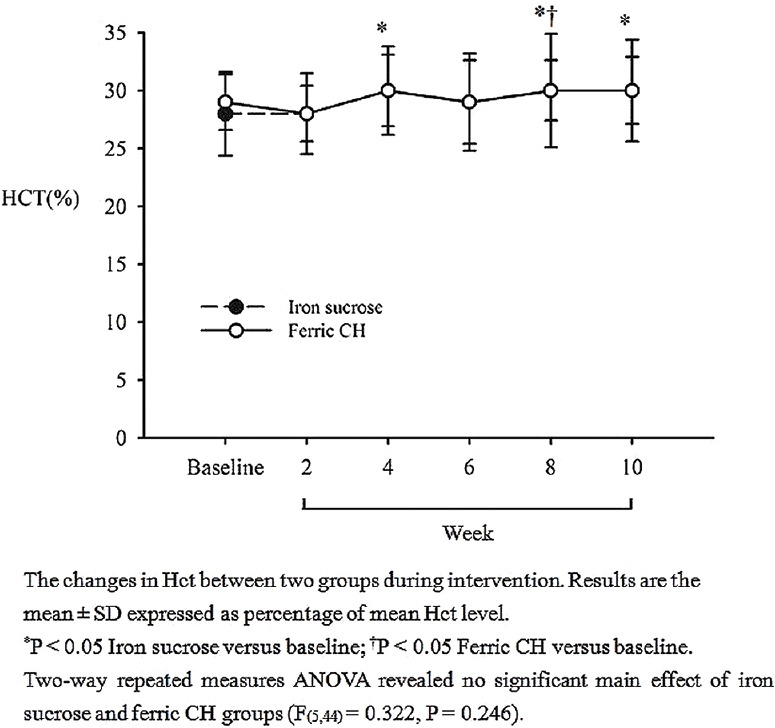
The comparison of serum haematocrit (%) ± standard deviation between iron sucrose and ferric chloride hexahydrate groups. Results are expressed as means (P = 0.246)

The comparison of serum haematocrit (%) ± standard deviation between iron sucrose and ferric chloride hexahydrate groups. Results are expressed as means (P = 0.246)