Figure 1.

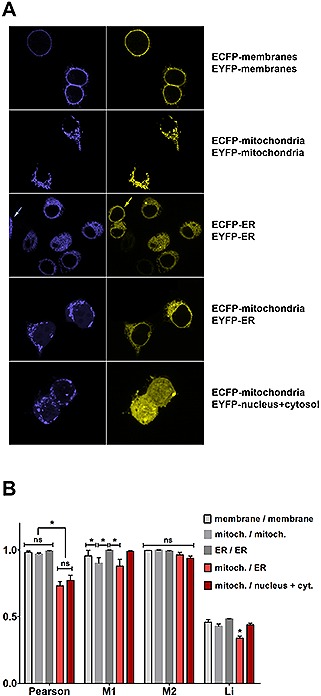
Confocal laser scanning microscopy of various subcellular compartments and classical colocalization analysis. (A) Representative confocal microscopy images of HEK293T cells transfected with expression plasmids coding for ECFP‐ and EYFP‐tagged cellular compartment markers localizing to the cytoplasmic membrane, mitochondria, ER or nucleus plus cytosol, as indicated next to the images. Microscopy was done with a Nikon A1 laser scanning microscope using a 60× oil immersion objective (NA 1.4). Complete colocalization is observed in the samples expressing ECFP‐ and EYFP‐tagged markers for the same compartment (upper three rows), whereas distinct localization is observed for the combination of ECFP‐mitochondrial marker with either an EYFP‐tagged ER marker or EYFP alone, which localizes to nucleus and cytosol (lower two rows). The yellow and the blue arrow indicate cells that are only labeled with one marker thereby verifying the selectivity of the detection. (B) Classical colocalization analysis of images transfected with compartment markers as in (A) using the coloc2‐plugin of the extended ImageJ version Fiji. The Pearson's R value was computed, as well as Manders' coefficients (M1 and M2) and the ICQ value according to Li as indicated (data represent mean +/– standard error of mean, n = 6, asterisks indicate a significant difference with p < 0.05; ”ns“ stands for ”not significant“; not specifically labeled columns do not exhibit significant differences from the other unlabeled columns). Analysis of variances (ANOVA) was performed followed by a Tukey's multiple comparisons test with GraphPad Prism 6.0.
