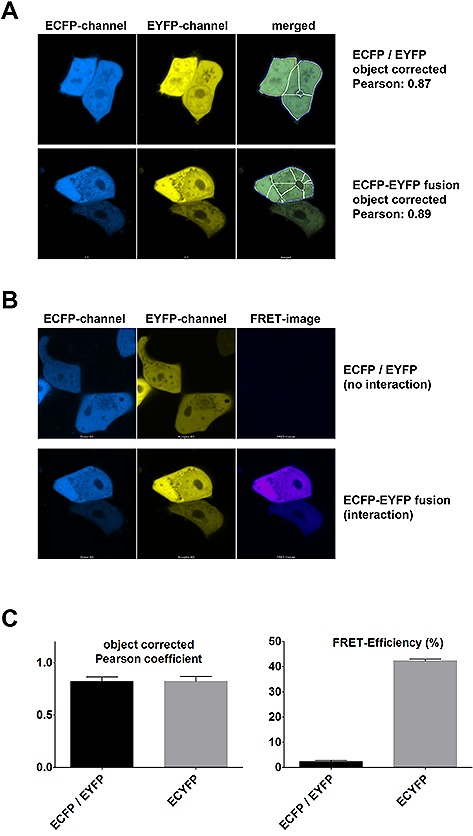
Figure 3.

FRET microscopy as final proof of proximity of molecules. (A) Laser scanning microscopy of HEK293T cells transfected with ECFP and EYFP that do not interact with each other, but which localize to the same compartments (upper panel) or transfected with an ECFP‐EYFP fusion protein, where the two fluorophores are in close proximity (about 5.3 nm, lower panel). An object‐corrected Pearson correlation coefficient was calculated as described in Fig. 2 and in the text. Blue lines in the merged image indicate the combination of objects above a MaxEntropy threshold, white lines indicate colocalizing thresholded objects. Due to the threshold algorithm the lower expressing cell is not considered in the lower panel. (B) Laser scanning FRET microscopy of HEK293T cells transfected as in (A). A corrected FRET image has been calculated as described in the Methods section. (C) Left panel: Quantification of the object‐corrected Pearson coefficient for cells as transfected in (A and B) (mean +/– standard error of mean, n = 6). Right panel: Quantification of the apparent FRET‐efficiency of these cells as described in the Methods section (mean +/– standard error of mean, n = 6).
