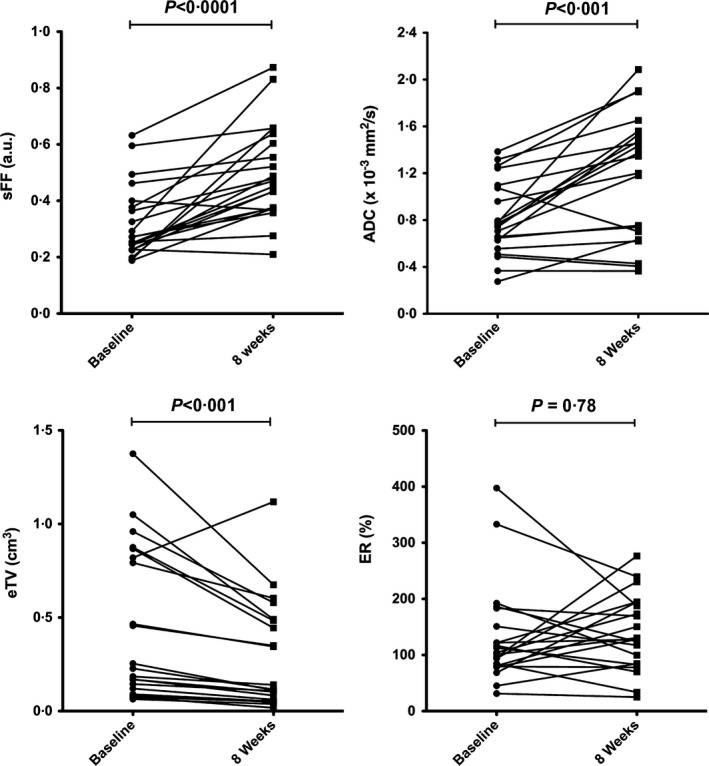
Figure 2.

Temporal changes in MRI parameters across entire cohort. Signal fat fraction (sFF), apparent diffusion coefficient (ADC), estimated tumour volume (eTV) and enhancement ratio (ER) at 8 weeks compared with baseline across the entire cohort (n = 21). Data for each patient (median for each parameter) are given. Wilcoxon signed‐matched rank test was used to assess temporal changes of MRI parameters and P < 0·05 defined as significant.
