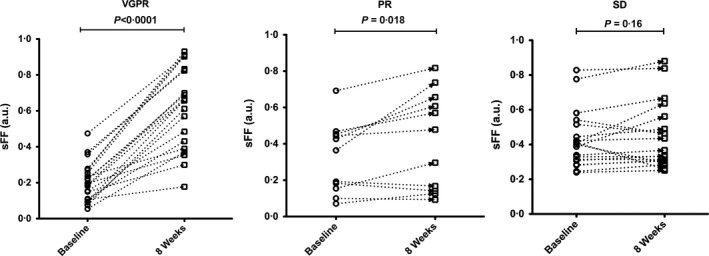
Figure 4.

Lesional signal fat fraction (sFF) changes for representative patients achieving very good partial response (VGPR), partial response (PR) and stable disease (SD) following induction chemotherapy. Data points in each graph represent focal lesions at baseline and 8 weeks after starting treatment. To assess the temporal changes, a Wilcoxon matched‐pairs signed rank test was used and P < 0·05 was defined as significant.
