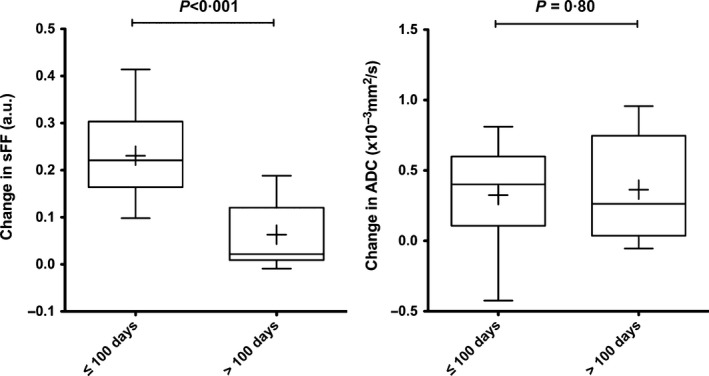
Figure 5.

Magnitude of changes in signal fat fraction (sFF) and apparent diffusion coefficient (ADC) according to speed of biochemical response. Changes from baseline [(8 weeks)−(baseline)] were assessed separately for patients who reached their maximal response (lowest paraprotein level) within 100 days (n = 11) versus those who took longer than 100 days (n = 10). Box and whisker plots of changes in sFF and ADC. The boundaries of the box show 25th and 75th percentiles, and the line within the box is the median. Whiskers show 10th and 90th percentiles. Means are shown (+). An unpaired t‐test was used to assess changes in MRI parameters [(8‐week values)−(baseline values)] between the two patient groups and P < 0·05 was defined as significant.
