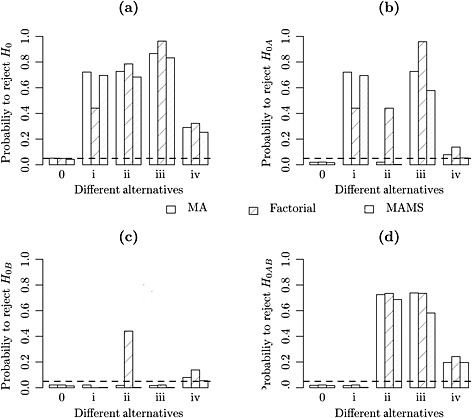
Figure 5.

In each of the four plots the probability of rejecting the null hypothesis is depicted for multi‐arm, factorial and multi‐arm multi‐stage designs for all five alternative hypothesis scenarios when (a) the global null hypothesis is rejected (b) the hypothesis for experimental treatment A is rejected (c) the hypothesis for experimental treatment B is rejected (d) the hypothesis for the combination treatment is rejected. We depict with the dashed line the type I error reference level at 0.05.
