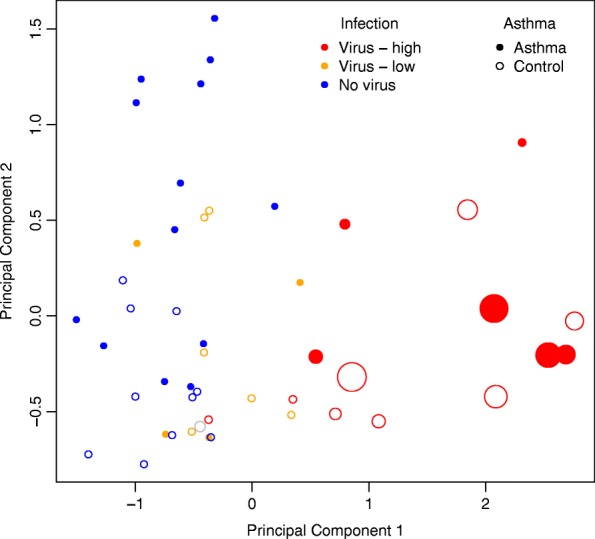
Fig. 4.

Multidimensional scaling plot of host airway brushing gene expression for virus-infected and non-infected samples. Data shown for Ion Torrent Proton sequenced nasal transcriptome samples among 14 Virus-High subjects (red), 10 Virus-Low subjects (orange), and 23 No-Virus subjects (blue). Note: the Control-7 sample, which exhibited monogenic viral genome coverage, is shown in gray. Asthmatics are marked with filled circles, while healthy controls are plotted with empty circles. Circle sizes correspond to coverage depth of the viral sequence detected with RNA-seq
