
Fig. 2.
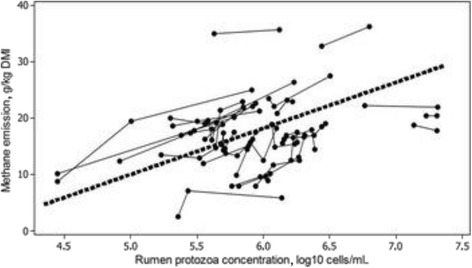
Relationship between methane emission and rumen protozoa concentration in a meta-analysis of 28 different experiments. The black dashed line represents the average within-experiment relationship. Reproduced from [56] with permission
Official websites use .gov
A
.gov website belongs to an official
government organization in the United States.
Secure .gov websites use HTTPS
A lock (
) or https:// means you've safely
connected to the .gov website. Share sensitive
information only on official, secure websites.
Relationship between methane emission and rumen protozoa concentration in a meta-analysis of 28 different experiments. The black dashed line represents the average within-experiment relationship. Reproduced from [56] with permission