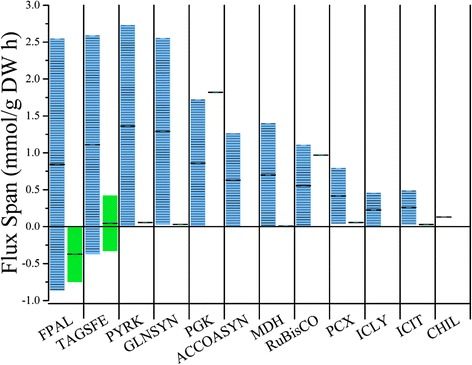
Fig. 3.

Allowable variation in flux for central metabolic reactions. Bars visualize the flux variability through important pathways. . Blue/lined bars are diazotrophic fluxes and green/solid bars are photoautotrophic fluxes. High variability implies adaptable responses while low variability implies a narrow essentiality for biomass and energy generation. Greater variability was displayed between cell types in similar pathways including glycolysis (FPAL, PYRK, PGK), the Calvin Cycle (TAGSFE, RuBisCO) and nitrogen processing (GLNSYN) while smaller variability was through the TCA cycle (ACCOASYN, MDH, ICIT) and the glyoxylate shunt (ICLY). Non-zero fluxes were found for the photoautotroph in PGK and RuBisCO while reversibility was found in both cell types for FPAL and TAGSFE. Greater variabilities through carbon processing were due to redundancies in cellular processing, while less variability or non-zero variability was found in non-redundant pathways like carbon and nitrogen fixation. Abbreviations are found under “Enzymes” in the Abbreviations section
