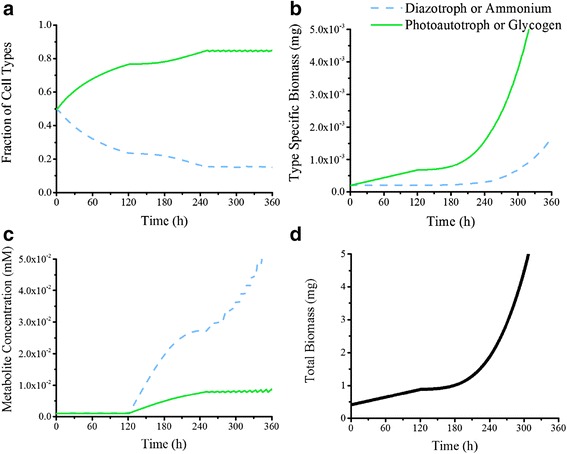
Fig. 5.

Computational population rates for T. erythraeum. Dotted blue lines indicate diazotroph or fixed nitrogen, green lines indicate photoautotroph or glycogen. a Fraction of population for each cell type. Three phases of growth are present: linear redistribution of cells to create enough photoautotrophs, steady preferential allocation to photoautotrophs to drive biomass generation, and achievement of equilibrium. Equilibrium is 0.1544 diazotroph and 0.8456 photoautotroph. b Growth rates of each cell type. Biomass is modeled using a batch reactor model with growth rate determined by FBA using the genome-scale reconstruction and time steps of 1 h. c Medium concentration for metabolites. These indicate the metabolite accumulation in the medium as determined by the amount of metabolite produced by each cell type less the metabolite consumed plus the amount of metabolite already existing in solution. d Total growth rate of population. This is the total growth rate and is plotted with experimental growth rates in Fig. 1. It is calculated by adding the two biomasses in B together
