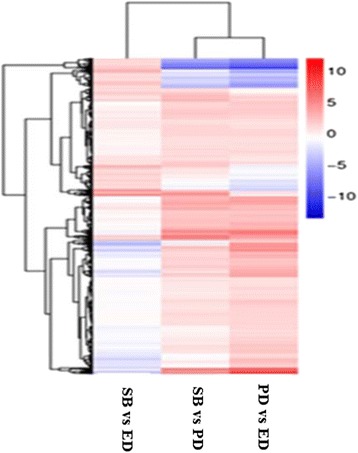
Fig. 2.

Cluster analysis of gene expression based on log ratio RPKM data. The cluster display expression patterns for a subset of DEGs in three comparisons (PD vs ED, SB vs ED and SB vs PD). Each column represents an experimental condition and each row represents a gene. Red means up-regulated and blue means down-regulated
