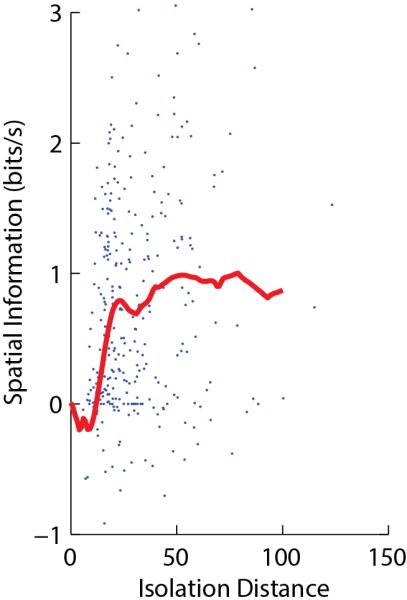
Figure 2.

Quantitative measures of unit isolation in extracellular electrophysiology. Each point represents a single neuron recorded in CA1 of a rat exploring an environment, showing isolation distance (a measure of unit isolation quality54) vs. estimated spatial information content (which can be negative as it is computed by cross-validation142). The red curve represents a running median. The curve reaches an asymptote of ~1 bit/s for values of isolation distance greater than ~20, indicating that this is the true average for well-isolated cells. Data reanalyzed from Ref.142, with some points above the top y-axis value truncated for visualization purposes.
